Profil de pauvreté dans les pays de la CEDEAO - United Nations ...
Profil de pauvreté dans les pays de la CEDEAO - United Nations ...
Profil de pauvreté dans les pays de la CEDEAO - United Nations ...

You also want an ePaper? Increase the reach of your titles
YUMPU automatically turns print PDFs into web optimized ePapers that Google loves.
96 <strong>Profil</strong> <strong>de</strong> <strong>pauvreté</strong> <strong>dans</strong> <strong>les</strong> <strong>pays</strong> <strong>de</strong> <strong>la</strong> <strong>CEDEAO</strong><br />
Tableau NE. 4<br />
Taux <strong>de</strong> <strong>pauvreté</strong>, profon<strong>de</strong>ur et sévérité<br />
<strong>de</strong> <strong>la</strong> <strong>pauvreté</strong> selon <strong>les</strong> régions, Niger, QUIBB 2005<br />
Taux <strong>de</strong> <strong>pauvreté</strong><br />
(%)<br />
Profon<strong>de</strong>ur<br />
<strong>de</strong> <strong>pauvreté</strong><br />
Sévérité<br />
<strong>de</strong> <strong>la</strong> <strong>pauvreté</strong><br />
Maradi 80 0,351 0,190<br />
Zin<strong>de</strong>r 71 0,262 0,129<br />
Til<strong>la</strong>béri 69 0,268 0,139<br />
Dosso 67 0,288 0,153<br />
Aga<strong>de</strong>z 46 0,161 0,081<br />
Tahoua 46 0,145 0,062<br />
Niamey 27 0,072 0,028<br />
Diffa 19 0,053 0,022<br />
Source : Institut national <strong>de</strong> statistique et Banque mondiale,<br />
2006, <strong>Profil</strong> <strong>de</strong> <strong>pauvreté</strong>. Rapport d’analyse.<br />
Note : Sur <strong>la</strong> base <strong>de</strong>s lignes <strong>de</strong> <strong>pauvreté</strong> globa<strong>les</strong>.<br />
Tableau NE. 5<br />
Taux <strong>de</strong> <strong>pauvreté</strong> selon le sexe du chef <strong>de</strong> ménage,<br />
Niger, QUIBB 2005<br />
Taux <strong>de</strong> <strong>pauvreté</strong><br />
(% <strong>de</strong>s ménages)<br />
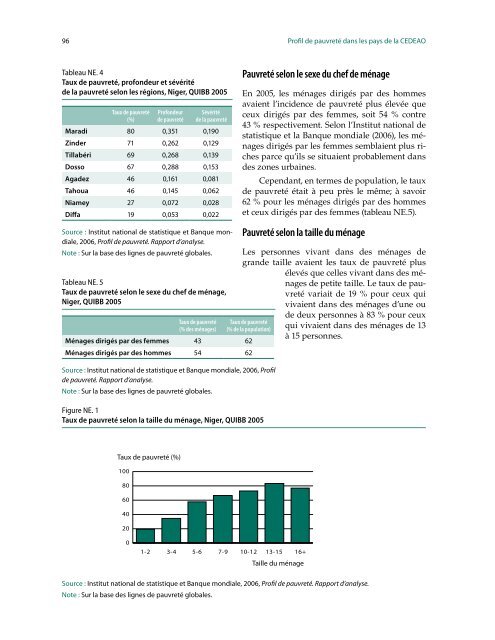
Figure NE. 1<br />
Taux <strong>de</strong> <strong>pauvreté</strong> selon <strong>la</strong> taille du ménage, Niger, QUIBB 2005<br />
Pauvreté selon le sexe du chef <strong>de</strong> ménage<br />
En 2005, <strong>les</strong> ménages dirigés par <strong>de</strong>s hommes<br />
avaient l’inci<strong>de</strong>nce <strong>de</strong> <strong>pauvreté</strong> plus élevée que<br />
ceux dirigés par <strong>de</strong>s femmes, soit 54 % contre<br />
43 % respectivement. Selon l’Institut national <strong>de</strong><br />
statistique et <strong>la</strong> Banque mondiale (2006), <strong>les</strong> ménages<br />
dirigés par <strong>les</strong> femmes semb<strong>la</strong>ient plus riches<br />
parce qu’ils se situaient probablement <strong>dans</strong><br />
<strong>de</strong>s zones urbaines.<br />
Cependant, en termes <strong>de</strong> popu<strong>la</strong>tion, le taux<br />
<strong>de</strong> <strong>pauvreté</strong> était à peu près le même; à savoir<br />
62 % pour <strong>les</strong> ménages dirigés par <strong>de</strong>s hommes<br />
et ceux dirigés par <strong>de</strong>s femmes (tableau NE.5).<br />
Pauvreté selon <strong>la</strong> taille du ménage<br />
Les personnes vivant <strong>dans</strong> <strong>de</strong>s ménages <strong>de</strong><br />
gran<strong>de</strong> taille avaient <strong>les</strong> taux <strong>de</strong> <strong>pauvreté</strong> plus<br />
élevés que cel<strong>les</strong> vivant <strong>dans</strong> <strong>de</strong>s ménages<br />
<strong>de</strong> petite taille. Le taux <strong>de</strong> <strong>pauvreté</strong><br />
variait <strong>de</strong> 19 % pour ceux qui<br />
vivaient <strong>dans</strong> <strong>de</strong>s ménages d’une ou<br />
Taux <strong>de</strong> <strong>pauvreté</strong><br />
(% <strong>de</strong> <strong>la</strong> popu<strong>la</strong>tion)<br />
Ménages dirigés par <strong>de</strong>s femmes 43 62<br />
Ménages dirigés par <strong>de</strong>s hommes 54 62<br />
Source : Institut national <strong>de</strong> statistique et Banque mondiale, 2006, <strong>Profil</strong><br />
<strong>de</strong> <strong>pauvreté</strong>. Rapport d’analyse.<br />
Note : Sur <strong>la</strong> base <strong>de</strong>s lignes <strong>de</strong> <strong>pauvreté</strong> globa<strong>les</strong>.<br />
Taux <strong>de</strong> <strong>pauvreté</strong> (%)<br />
100<br />
80<br />
60<br />
40<br />
20<br />
0<br />
1-2 3-4 5-6 7-9 10-12 13-15 16+<br />
Taille du ménage<br />
<strong>de</strong> <strong>de</strong>ux personnes à 83 % pour ceux<br />
qui vivaient <strong>dans</strong> <strong>de</strong>s ménages <strong>de</strong> 13<br />
à 15 personnes.<br />
Source : Institut national <strong>de</strong> statistique et Banque mondiale, 2006, <strong>Profil</strong> <strong>de</strong> <strong>pauvreté</strong>. Rapport d’analyse.<br />
Note : Sur <strong>la</strong> base <strong>de</strong>s lignes <strong>de</strong> <strong>pauvreté</strong> globa<strong>les</strong>.