Profil de pauvreté dans les pays de la CEDEAO - United Nations ...
Profil de pauvreté dans les pays de la CEDEAO - United Nations ...
Profil de pauvreté dans les pays de la CEDEAO - United Nations ...

You also want an ePaper? Increase the reach of your titles
YUMPU automatically turns print PDFs into web optimized ePapers that Google loves.
Gambie 55<br />
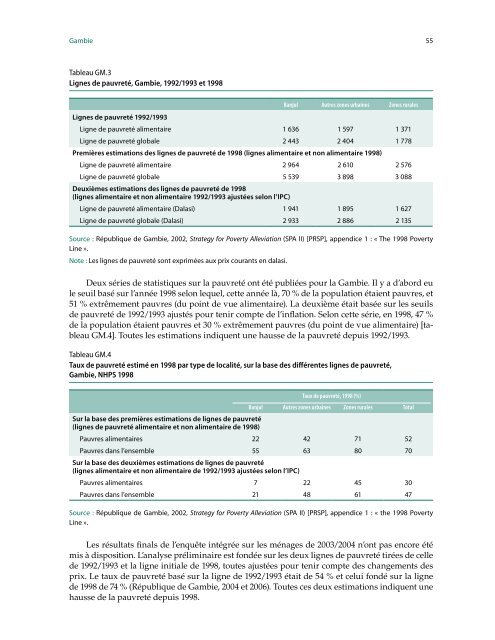
Tableau GM.3<br />
Lignes <strong>de</strong> <strong>pauvreté</strong>, Gambie, 1992/1993 et 1998<br />
Banjul Autres zones urbaines Zones rura<strong>les</strong><br />
Lignes <strong>de</strong> <strong>pauvreté</strong> 1992/1993<br />
Ligne <strong>de</strong> <strong>pauvreté</strong> alimentaire 1 636 1 597 1 371<br />
Ligne <strong>de</strong> <strong>pauvreté</strong> globale 2 443 2 404 1 778<br />
Premières estimations <strong>de</strong>s lignes <strong>de</strong> <strong>pauvreté</strong> <strong>de</strong> 1998 (lignes alimentaire et non alimentaire 1998)<br />
Ligne <strong>de</strong> <strong>pauvreté</strong> alimentaire 2 964 2 610 2 576<br />
Ligne <strong>de</strong> <strong>pauvreté</strong> globale<br />
Deuxièmes estimations <strong>de</strong>s lignes <strong>de</strong> <strong>pauvreté</strong> <strong>de</strong> 1998<br />
5 539 3 898 3 088<br />
(lignes alimentaire et non alimentaire 1992/1993 ajustées selon l’IPC)<br />
Ligne <strong>de</strong> <strong>pauvreté</strong> alimentaire (Da<strong>la</strong>si) 1 941 1 895 1 627<br />
Ligne <strong>de</strong> <strong>pauvreté</strong> globale (Da<strong>la</strong>si) 2 933 2 886 2 135<br />
Source : République <strong>de</strong> Gambie, 2002, Strategy for Poverty Alleviation (SPA II) [PRSP], appendice 1 : « The 1998 Poverty<br />
Line ».<br />
Note : Les lignes <strong>de</strong> <strong>pauvreté</strong> sont exprimées aux prix courants en da<strong>la</strong>si.<br />
Deux séries <strong>de</strong> statistiques sur <strong>la</strong> <strong>pauvreté</strong> ont été publiées pour <strong>la</strong> Gambie. Il y a d’abord eu<br />
le seuil basé sur l’année 1998 selon lequel, cette année là, 70 % <strong>de</strong> <strong>la</strong> popu<strong>la</strong>tion étaient pauvres, et<br />
51 % extrêmement pauvres (du point <strong>de</strong> vue alimentaire). La <strong>de</strong>uxième était basée sur <strong>les</strong> seuils<br />
<strong>de</strong> <strong>pauvreté</strong> <strong>de</strong> 1992/1993 ajustés pour tenir compte <strong>de</strong> l’inf<strong>la</strong>tion. Selon cette série, en 1998, 47 %<br />
<strong>de</strong> <strong>la</strong> popu<strong>la</strong>tion étaient pauvres et 30 % extrêmement pauvres (du point <strong>de</strong> vue alimentaire) [tableau<br />
GM.4]. Toutes <strong>les</strong> estimations indiquent une hausse <strong>de</strong> <strong>la</strong> <strong>pauvreté</strong> <strong>de</strong>puis 1992/1993.<br />
Tableau GM.4<br />
Taux <strong>de</strong> <strong>pauvreté</strong> estimé en 1998 par type <strong>de</strong> localité, sur <strong>la</strong> base <strong>de</strong>s différentes lignes <strong>de</strong> <strong>pauvreté</strong>,<br />
Gambie, NHPS 1998<br />
Taux <strong>de</strong> <strong>pauvreté</strong>, 1998 (%)<br />
Banjul Autres zones urbaines Zones rura<strong>les</strong> Total<br />
Sur <strong>la</strong> base <strong>de</strong>s premières estimations <strong>de</strong> lignes <strong>de</strong> <strong>pauvreté</strong><br />
(lignes <strong>de</strong> <strong>pauvreté</strong> alimentaire et non alimentaire <strong>de</strong> 1998)<br />
Pauvres alimentaires 22 42 71 52<br />
Pauvres <strong>dans</strong> l’ensemble 55 63 80 70<br />
Sur <strong>la</strong> base <strong>de</strong>s <strong>de</strong>uxièmes estimations <strong>de</strong> lignes <strong>de</strong> <strong>pauvreté</strong><br />
(lignes alimentaire et non alimentaire <strong>de</strong> 1992/1993 ajustées selon l’IPC)<br />
Pauvres alimentaires 7 22 45 30<br />
Pauvres <strong>dans</strong> l’ensemble 21 48 61 47<br />
Source : République <strong>de</strong> Gambie, 2002, Strategy for Poverty Alleviation (SPA II) [PRSP], appendice 1 : « the 1998 Poverty<br />
Line ».<br />
Les résultats finals <strong>de</strong> l’enquête intégrée sur <strong>les</strong> ménages <strong>de</strong> 2003/2004 n’ont pas encore été<br />
mis à disposition. L’analyse préliminaire est fondée sur <strong>les</strong> <strong>de</strong>ux lignes <strong>de</strong> <strong>pauvreté</strong> tirées <strong>de</strong> celle<br />
<strong>de</strong> 1992/1993 et <strong>la</strong> ligne initiale <strong>de</strong> 1998, toutes ajustées pour tenir compte <strong>de</strong>s changements <strong>de</strong>s<br />
prix. Le taux <strong>de</strong> <strong>pauvreté</strong> basé sur <strong>la</strong> ligne <strong>de</strong> 1992/1993 était <strong>de</strong> 54 % et celui fondé sur <strong>la</strong> ligne<br />
<strong>de</strong> 1998 <strong>de</strong> 74 % (République <strong>de</strong> Gambie, 2004 et 2006). Toutes ces <strong>de</strong>ux estimations indiquent une<br />
hausse <strong>de</strong> <strong>la</strong> <strong>pauvreté</strong> <strong>de</strong>puis 1998.