Profil de pauvreté dans les pays de la CEDEAO - United Nations ...
Profil de pauvreté dans les pays de la CEDEAO - United Nations ...
Profil de pauvreté dans les pays de la CEDEAO - United Nations ...

Create successful ePaper yourself
Turn your PDF publications into a flip-book with our unique Google optimized e-Paper software.
Ghana 65<br />
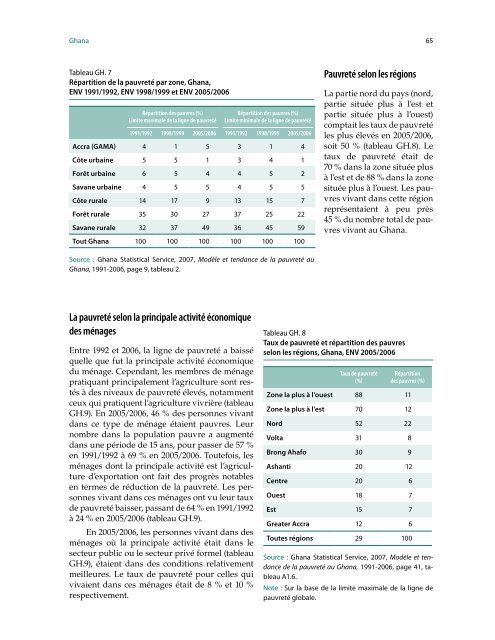
Tableau GH. 7<br />
Répartition <strong>de</strong> <strong>la</strong> <strong>pauvreté</strong> par zone, Ghana,<br />
ENV 1991/1992, ENV 1998/1999 et ENV 2005/2006<br />
Répartition <strong>de</strong>s pauvres (%)<br />
Limite maximale <strong>de</strong> <strong>la</strong> ligne <strong>de</strong> <strong>pauvreté</strong><br />
La <strong>pauvreté</strong> selon <strong>la</strong> principale activité économique<br />
<strong>de</strong>s ménages<br />
Entre 1992 et 2006, <strong>la</strong> ligne <strong>de</strong> <strong>pauvreté</strong> a baissé<br />
quelle que fut <strong>la</strong> principale activité économique<br />
du ménage. Cependant, <strong>les</strong> membres <strong>de</strong> ménage<br />
pratiquant principalement l’agriculture sont restés<br />
à <strong>de</strong>s niveaux <strong>de</strong> <strong>pauvreté</strong> élevés, notamment<br />
ceux qui pratiquent l’agriculture vivrière (tableau<br />
GH.9). En 2005/2006, 46 % <strong>de</strong>s personnes vivant<br />
<strong>dans</strong> ce type <strong>de</strong> ménage étaient pauvres. Leur<br />
nombre <strong>dans</strong> <strong>la</strong> popu<strong>la</strong>tion pauvre a augmenté<br />
<strong>dans</strong> une pério<strong>de</strong> <strong>de</strong> 15 ans, pour passer <strong>de</strong> 57 %<br />
en 1991/1992 à 69 % en 2005/2006. Toutefois, <strong>les</strong><br />
ménages dont <strong>la</strong> principale activité est l’agriculture<br />
d’exportation ont fait <strong>de</strong>s progrès notab<strong>les</strong><br />
en termes <strong>de</strong> réduction <strong>de</strong> <strong>la</strong> <strong>pauvreté</strong>. Les personnes<br />
vivant <strong>dans</strong> ces ménages ont vu leur taux<br />
<strong>de</strong> <strong>pauvreté</strong> baisser, passant <strong>de</strong> 64 % en 1991/1992<br />
à 24 % en 2005/2006 (tableau GH.9).<br />
En 2005/2006, <strong>les</strong> personnes vivant <strong>dans</strong> <strong>de</strong>s<br />
ménages où <strong>la</strong> principale activité était <strong>dans</strong> le<br />
secteur public ou le secteur privé formel (tableau<br />
GH.9), étaient <strong>dans</strong> <strong>de</strong>s conditions re<strong>la</strong>tivement<br />
meilleures. Le taux <strong>de</strong> <strong>pauvreté</strong> pour cel<strong>les</strong> qui<br />
vivaient <strong>dans</strong> ces ménages était <strong>de</strong> 8 % et 10 %<br />
respectivement.<br />
Répartition <strong>de</strong>s pauvres (%)<br />
Limite minimale <strong>de</strong> <strong>la</strong> ligne <strong>de</strong> <strong>pauvreté</strong><br />
1991/1992 1998/1999 2005/2006 1991/1992 1998/1999 2005/2006<br />
Accra (GAMA) 4 1 5 3 1 4<br />
Côte urbaine 5 5 1 3 4 1<br />
Forêt urbaine 6 5 4 4 5 2<br />
Savane urbaine 4 5 5 4 5 5<br />
Côte rurale 14 17 9 13 15 7<br />
Forêt rurale 35 30 27 37 25 22<br />
Savane rurale 32 37 49 36 45 59<br />
Tout Ghana 100 100 100 100 100 100<br />
Source : Ghana Statistical Service, 2007, Modèle et tendance <strong>de</strong> <strong>la</strong> <strong>pauvreté</strong> au<br />
Ghana, 1991-2006, page 9, tableau 2.<br />
Pauvreté selon <strong>les</strong> régions<br />
La partie nord du <strong>pays</strong> (nord,<br />
partie située plus à l’est et<br />
partie située plus à l’ouest)<br />
comptait <strong>les</strong> taux <strong>de</strong> <strong>pauvreté</strong><br />
<strong>les</strong> plus élevés en 2005/2006,<br />
soit 50 % (tableau GH.8). Le<br />
taux <strong>de</strong> <strong>pauvreté</strong> était <strong>de</strong><br />
70 % <strong>dans</strong> <strong>la</strong> zone située plus<br />
à l’est et <strong>de</strong> 88 % <strong>dans</strong> <strong>la</strong> zone<br />
située plus à l’ouest. Les pauvres<br />
vivant <strong>dans</strong> cette région<br />
représentaient à peu près<br />
45 % du nombre total <strong>de</strong> pauvres<br />
vivant au Ghana.<br />
Tableau GH. 8<br />
Taux <strong>de</strong> <strong>pauvreté</strong> et répartition <strong>de</strong>s pauvres<br />
selon <strong>les</strong> régions, Ghana, ENV 2005/2006<br />
Taux <strong>de</strong> <strong>pauvreté</strong><br />
(%)<br />
Répartition<br />
<strong>de</strong>s pauvres (%)<br />
Zone <strong>la</strong> plus à l’ouest 88 11<br />
Zone <strong>la</strong> plus à l’est 70 12<br />
Nord 52 22<br />
Volta 31 8<br />
Brong Ahafo 30 9<br />
Ashanti 20 12<br />
Centre 20 6<br />
Ouest 18 7<br />
Est 15 7<br />
Greater Accra 12 6<br />
Toutes régions 29 100<br />
Source : Ghana Statistical Service, 2007, Modèle et tendance<br />
<strong>de</strong> <strong>la</strong> <strong>pauvreté</strong> au Ghana, 1991-2006, page 41, tableau<br />
A1.6.<br />
Note : Sur <strong>la</strong> base <strong>de</strong> <strong>la</strong> limite maximale <strong>de</strong> <strong>la</strong> ligne <strong>de</strong><br />
<strong>pauvreté</strong> globale.