Profil de pauvreté dans les pays de la CEDEAO - United Nations ...
Profil de pauvreté dans les pays de la CEDEAO - United Nations ...
Profil de pauvreté dans les pays de la CEDEAO - United Nations ...

Create successful ePaper yourself
Turn your PDF publications into a flip-book with our unique Google optimized e-Paper software.
42 <strong>Profil</strong> <strong>de</strong> <strong>pauvreté</strong> <strong>dans</strong> <strong>les</strong> <strong>pays</strong> <strong>de</strong> <strong>la</strong> <strong>CEDEAO</strong><br />
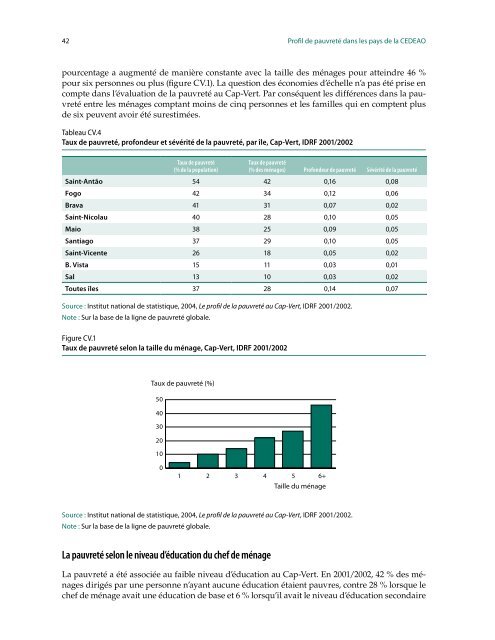
pourcentage a augmenté <strong>de</strong> manière constante avec <strong>la</strong> taille <strong>de</strong>s ménages pour atteindre 46 %<br />
pour six personnes ou plus (figure CV.1). La question <strong>de</strong>s économies d’échelle n’a pas été prise en<br />
compte <strong>dans</strong> l’évaluation <strong>de</strong> <strong>la</strong> <strong>pauvreté</strong> au Cap-Vert. Par conséquent <strong>les</strong> différences <strong>dans</strong> <strong>la</strong> <strong>pauvreté</strong><br />
entre <strong>les</strong> ménages comptant moins <strong>de</strong> cinq personnes et <strong>les</strong> famil<strong>les</strong> qui en comptent plus<br />
<strong>de</strong> six peuvent avoir été surestimées.<br />
Tableau CV.4<br />
Taux <strong>de</strong> <strong>pauvreté</strong>, profon<strong>de</strong>ur et sévérité <strong>de</strong> <strong>la</strong> <strong>pauvreté</strong>, par île, Cap-Vert, IDRF 2001/2002<br />
Taux <strong>de</strong> <strong>pauvreté</strong><br />
(% <strong>de</strong> <strong>la</strong> popu<strong>la</strong>tion)<br />
Taux <strong>de</strong> <strong>pauvreté</strong><br />
(% <strong>de</strong>s ménages) Profon<strong>de</strong>ur <strong>de</strong> <strong>pauvreté</strong> Sévérité <strong>de</strong> <strong>la</strong> <strong>pauvreté</strong><br />
Saint-Antão 54 42 0,16 0,08<br />
Fogo 42 34 0,12 0,06<br />
Brava 41 31 0,07 0,02<br />
Saint-Nico<strong>la</strong>u 40 28 0,10 0,05<br />
Maio 38 25 0,09 0,05<br />
Santiago 37 29 0,10 0,05<br />
Saint-Vicente 26 18 0,05 0,02<br />
B. Vista 15 11 0,03 0,01<br />
Sal 13 10 0,03 0,02<br />
Toutes î<strong>les</strong> 37 28 0,14 0,07<br />
Source : Institut national <strong>de</strong> statistique, 2004, Le profil <strong>de</strong> <strong>la</strong> <strong>pauvreté</strong> au CapVert, IDRF 2001/2002.<br />
Note : Sur <strong>la</strong> base <strong>de</strong> <strong>la</strong> ligne <strong>de</strong> <strong>pauvreté</strong> globale.<br />
Figure CV.1<br />
Taux <strong>de</strong> <strong>pauvreté</strong> selon <strong>la</strong> taille du ménage, Cap-Vert, IDRF 2001/2002<br />
Taux <strong>de</strong> <strong>pauvreté</strong> (%)<br />
50<br />
40<br />
30<br />
20<br />
10<br />
0<br />
1 2 3 4 5 6 +<br />
Taille du ménage<br />
Source : Institut national <strong>de</strong> statistique, 2004, Le profil <strong>de</strong> <strong>la</strong> <strong>pauvreté</strong> au CapVert, IDRF 2001/2002.<br />
Note : Sur <strong>la</strong> base <strong>de</strong> <strong>la</strong> ligne <strong>de</strong> <strong>pauvreté</strong> globale.<br />
La <strong>pauvreté</strong> selon le niveau d’éducation du chef <strong>de</strong> ménage<br />
La <strong>pauvreté</strong> a été associée au faible niveau d’éducation au Cap-Vert. En 2001/2002, 42 % <strong>de</strong>s ménages<br />
dirigés par une personne n’ayant aucune éducation étaient pauvres, contre 28 % lorsque le<br />
chef <strong>de</strong> ménage avait une éducation <strong>de</strong> base et 6 % lorsqu’il avait le niveau d’éducation secondaire