Profil de pauvreté dans les pays de la CEDEAO - United Nations ...
Profil de pauvreté dans les pays de la CEDEAO - United Nations ...
Profil de pauvreté dans les pays de la CEDEAO - United Nations ...

Create successful ePaper yourself
Turn your PDF publications into a flip-book with our unique Google optimized e-Paper software.
Cap-Vert 41<br />
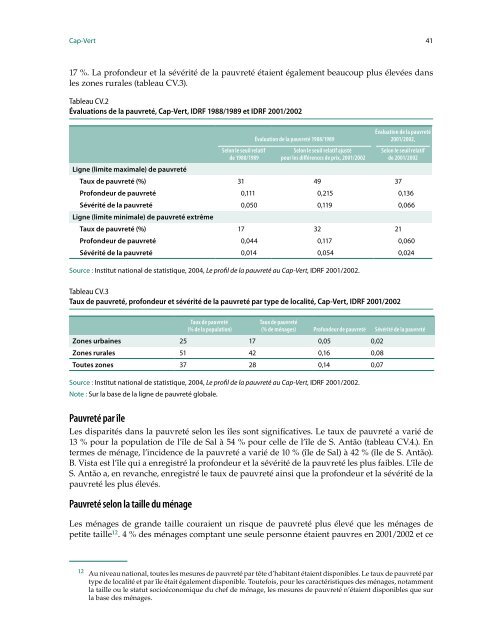
17 %. La profon<strong>de</strong>ur et <strong>la</strong> sévérité <strong>de</strong> <strong>la</strong> <strong>pauvreté</strong> étaient également beaucoup plus élevées <strong>dans</strong><br />
<strong>les</strong> zones rura<strong>les</strong> (tableau CV.3).<br />
Tableau CV.2<br />
Évaluations <strong>de</strong> <strong>la</strong> <strong>pauvreté</strong>, Cap-Vert, IDRF 1988/1989 et IDRF 2001/2002<br />
Selon le seuil re<strong>la</strong>tif<br />
<strong>de</strong> 1988/1989<br />
Évaluation <strong>de</strong> <strong>la</strong> <strong>pauvreté</strong> 1988/1989<br />
Selon le seuil re<strong>la</strong>tif ajusté<br />
pour <strong>les</strong> différences <strong>de</strong> prix, 2001/2002<br />
Évaluation <strong>de</strong> <strong>la</strong> <strong>pauvreté</strong><br />
2001/2002,<br />
Selon le seuil re<strong>la</strong>tif<br />
<strong>de</strong> 2001/2002<br />
Ligne (limite maximale) <strong>de</strong> <strong>pauvreté</strong><br />
Taux <strong>de</strong> <strong>pauvreté</strong> (%) 31 49 37<br />
Profon<strong>de</strong>ur <strong>de</strong> <strong>pauvreté</strong> 0,111 0,215 0,136<br />
Sévérité <strong>de</strong> <strong>la</strong> <strong>pauvreté</strong><br />
Ligne (limite minimale) <strong>de</strong> <strong>pauvreté</strong> extrême<br />
0,050 0,119 0,066<br />
Taux <strong>de</strong> <strong>pauvreté</strong> (%) 17 32 21<br />
Profon<strong>de</strong>ur <strong>de</strong> <strong>pauvreté</strong> 0,044 0,117 0,060<br />
Sévérité <strong>de</strong> <strong>la</strong> <strong>pauvreté</strong> 0,014 0,054 0,024<br />
Source : Institut national <strong>de</strong> statistique, 2004, Le profil <strong>de</strong> <strong>la</strong> <strong>pauvreté</strong> au CapVert, IDRF 2001/2002.<br />
Tableau CV.3<br />
Taux <strong>de</strong> <strong>pauvreté</strong>, profon<strong>de</strong>ur et sévérité <strong>de</strong> <strong>la</strong> <strong>pauvreté</strong> par type <strong>de</strong> localité, Cap-Vert, IDRF 2001/2002<br />
Taux <strong>de</strong> <strong>pauvreté</strong><br />
(% <strong>de</strong> <strong>la</strong> popu<strong>la</strong>tion)<br />
Taux <strong>de</strong> <strong>pauvreté</strong><br />
(% <strong>de</strong> ménages) Profon<strong>de</strong>ur <strong>de</strong> <strong>pauvreté</strong> Sévérité <strong>de</strong> <strong>la</strong> <strong>pauvreté</strong><br />
Zones urbaines 25 17 0,05 0,02<br />
Zones rura<strong>les</strong> 51 42 0,16 0,08<br />
Toutes zones 37 28 0,14 0,07<br />
Source : Institut national <strong>de</strong> statistique, 2004, Le profil <strong>de</strong> <strong>la</strong> <strong>pauvreté</strong> au CapVert, IDRF 2001/2002.<br />
Note : Sur <strong>la</strong> base <strong>de</strong> <strong>la</strong> ligne <strong>de</strong> <strong>pauvreté</strong> globale.<br />
Pauvreté par île<br />
Les disparités <strong>dans</strong> <strong>la</strong> <strong>pauvreté</strong> selon <strong>les</strong> î<strong>les</strong> sont significatives. Le taux <strong>de</strong> <strong>pauvreté</strong> a varié <strong>de</strong><br />
13 % pour <strong>la</strong> popu<strong>la</strong>tion <strong>de</strong> l’île <strong>de</strong> Sal à 54 % pour celle <strong>de</strong> l’île <strong>de</strong> S. Antão (tableau CV.4.). En<br />
termes <strong>de</strong> ménage, l’inci<strong>de</strong>nce <strong>de</strong> <strong>la</strong> <strong>pauvreté</strong> a varié <strong>de</strong> 10 % (île <strong>de</strong> Sal) à 42 % (île <strong>de</strong> S. Antão).<br />
B. Vista est l’île qui a enregistré <strong>la</strong> profon<strong>de</strong>ur et <strong>la</strong> sévérité <strong>de</strong> <strong>la</strong> <strong>pauvreté</strong> <strong>les</strong> plus faib<strong>les</strong>. L’île <strong>de</strong><br />
S. Antão a, en revanche, enregistré le taux <strong>de</strong> <strong>pauvreté</strong> ainsi que <strong>la</strong> profon<strong>de</strong>ur et <strong>la</strong> sévérité <strong>de</strong> <strong>la</strong><br />
<strong>pauvreté</strong> <strong>les</strong> plus élevés.<br />
Pauvreté selon <strong>la</strong> taille du ménage<br />
Les ménages <strong>de</strong> gran<strong>de</strong> taille couraient un risque <strong>de</strong> <strong>pauvreté</strong> plus élevé que <strong>les</strong> ménages <strong>de</strong><br />
petite taille 12 . 4 % <strong>de</strong>s ménages comptant une seule personne étaient pauvres en 2001/2002 et ce<br />
12 Au niveau national, toutes <strong>les</strong> mesures <strong>de</strong> <strong>pauvreté</strong> par tête d’habitant étaient disponib<strong>les</strong>. Le taux <strong>de</strong> <strong>pauvreté</strong> par<br />
type <strong>de</strong> localité et par île était également disponible. Toutefois, pour <strong>les</strong> caractéristiques <strong>de</strong>s ménages, notamment<br />
<strong>la</strong> taille ou le statut socioéconomique du chef <strong>de</strong> ménage, <strong>les</strong> mesures <strong>de</strong> <strong>pauvreté</strong> n’étaient disponib<strong>les</strong> que sur<br />
<strong>la</strong> base <strong>de</strong>s ménages.