Profil de pauvreté dans les pays de la CEDEAO - United Nations ...
Profil de pauvreté dans les pays de la CEDEAO - United Nations ...
Profil de pauvreté dans les pays de la CEDEAO - United Nations ...
Create successful ePaper yourself
Turn your PDF publications into a flip-book with our unique Google optimized e-Paper software.
104 <strong>Profil</strong> <strong>de</strong> <strong>pauvreté</strong> <strong>dans</strong> <strong>les</strong> <strong>pays</strong> <strong>de</strong> <strong>la</strong> <strong>CEDEAO</strong><br />
Changement <strong>dans</strong> <strong>la</strong> <strong>pauvreté</strong> <strong>de</strong>puis 1985<br />
Le Bureau national <strong>de</strong> statistique du Nigéria a analysé <strong>les</strong> tendances <strong>dans</strong> <strong>les</strong> statistiques re<strong>la</strong>tives<br />
à <strong>la</strong> <strong>pauvreté</strong> qui ont été estimées sur <strong>la</strong> base <strong>de</strong>s lignes <strong>de</strong> <strong>pauvreté</strong> re<strong>la</strong>tives (Bureau national <strong>de</strong><br />
statistique, 2005). Il a été démontré par exemple que le taux <strong>de</strong> <strong>pauvreté</strong> pour <strong>la</strong> limite minimale<br />
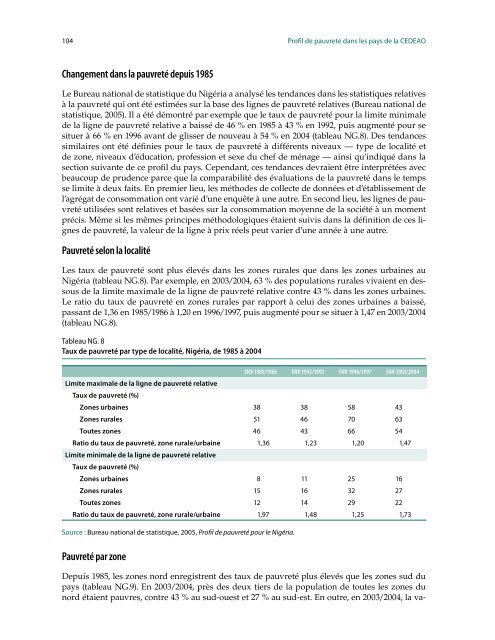
<strong>de</strong> <strong>la</strong> ligne <strong>de</strong> <strong>pauvreté</strong> re<strong>la</strong>tive a baissé <strong>de</strong> 46 % en 1985 à 43 % en 1992, puis augmenté pour se<br />
situer à 66 % en 1996 avant <strong>de</strong> glisser <strong>de</strong> nouveau à 54 % en 2004 (tableau NG.8). Des tendances<br />
simi<strong>la</strong>ires ont été définies pour le taux <strong>de</strong> <strong>pauvreté</strong> à différents niveaux — type <strong>de</strong> localité et<br />
<strong>de</strong> zone, niveaux d’éducation, profession et sexe du chef <strong>de</strong> ménage — ainsi qu’indiqué <strong>dans</strong> <strong>la</strong><br />
section suivante <strong>de</strong> ce profil du <strong>pays</strong>. Cependant, ces tendances <strong>de</strong>vraient être interprétées avec<br />
beaucoup <strong>de</strong> pru<strong>de</strong>nce parce que <strong>la</strong> comparabilité <strong>de</strong>s évaluations <strong>de</strong> <strong>la</strong> <strong>pauvreté</strong> <strong>dans</strong> le temps<br />
se limite à <strong>de</strong>ux faits. En premier lieu, <strong>les</strong> métho<strong>de</strong>s <strong>de</strong> collecte <strong>de</strong> données et d’établissement <strong>de</strong><br />
l’agrégat <strong>de</strong> consommation ont varié d’une enquête à une autre. En second lieu, <strong>les</strong> lignes <strong>de</strong> <strong>pauvreté</strong><br />
utilisées sont re<strong>la</strong>tives et basées sur <strong>la</strong> consommation moyenne <strong>de</strong> <strong>la</strong> société à un moment<br />
précis. Même si <strong>les</strong> mêmes principes méthodologiques étaient suivis <strong>dans</strong> <strong>la</strong> définition <strong>de</strong> ces lignes<br />
<strong>de</strong> <strong>pauvreté</strong>, <strong>la</strong> valeur <strong>de</strong> <strong>la</strong> ligne à prix réels peut varier d’une année à une autre.<br />
Pauvreté selon <strong>la</strong> localité<br />
Les taux <strong>de</strong> <strong>pauvreté</strong> sont plus élevés <strong>dans</strong> <strong>les</strong> zones rura<strong>les</strong> que <strong>dans</strong> <strong>les</strong> zones urbaines au<br />
Nigéria (tableau NG.8). Par exemple, en 2003/2004, 63 % <strong>de</strong>s popu<strong>la</strong>tions rura<strong>les</strong> vivaient en <strong>de</strong>ssous<br />
<strong>de</strong> <strong>la</strong> limite maximale <strong>de</strong> <strong>la</strong> ligne <strong>de</strong> <strong>pauvreté</strong> re<strong>la</strong>tive contre 43 % <strong>dans</strong> <strong>les</strong> zones urbaines.<br />
Le ratio du taux <strong>de</strong> <strong>pauvreté</strong> en zones rura<strong>les</strong> par rapport à celui <strong>de</strong>s zones urbaines a baissé,<br />
passant <strong>de</strong> 1,36 en 1985/1986 à 1,20 en 1996/1997, puis augmenté pour se situer à 1,47 en 2003/2004<br />
(tableau NG.8).<br />
Tableau NG. 8<br />
Taux <strong>de</strong> <strong>pauvreté</strong> par type <strong>de</strong> localité, Nigéria, <strong>de</strong> 1985 à 2004<br />
ENV 1985/1986 ENV 1992/1993 ENV 1996/1997 ENV 2003/2004<br />
Limite maximale <strong>de</strong> <strong>la</strong> ligne <strong>de</strong> <strong>pauvreté</strong> re<strong>la</strong>tive<br />
Taux <strong>de</strong> <strong>pauvreté</strong> (%)<br />
Zones urbaines 38 38 58 43<br />
Zones rura<strong>les</strong> 51 46 70 63<br />
Toutes zones 46 43 66 54<br />
Ratio du taux <strong>de</strong> <strong>pauvreté</strong>, zone rurale/urbaine<br />
Limite minimale <strong>de</strong> <strong>la</strong> ligne <strong>de</strong> <strong>pauvreté</strong> re<strong>la</strong>tive<br />
Taux <strong>de</strong> <strong>pauvreté</strong> (%)<br />
1,36 1,23 1,20 1,47<br />
Zones urbaines 8 11 25 16<br />
Zones rura<strong>les</strong> 15 16 32 27<br />
Toutes zones 12 14 29 22<br />
Ratio du taux <strong>de</strong> <strong>pauvreté</strong>, zone rurale/urbaine 1,97 1,48 1,25 1,73<br />
Source : Bureau national <strong>de</strong> statistique, 2005, <strong>Profil</strong> <strong>de</strong> <strong>pauvreté</strong> pour le Nigéria.<br />
Pauvreté par zone<br />
Depuis 1985, <strong>les</strong> zones nord enregistrent <strong>de</strong>s taux <strong>de</strong> <strong>pauvreté</strong> plus élevés que <strong>les</strong> zones sud du<br />
<strong>pays</strong> (tableau NG.9). En 2003/2004, près <strong>de</strong>s <strong>de</strong>ux tiers <strong>de</strong> <strong>la</strong> popu<strong>la</strong>tion <strong>de</strong> toutes <strong>les</strong> zones du<br />
nord étaient pauvres, contre 43 % au sud-ouest et 27 % au sud-est. En outre, en 2003/2004, <strong>la</strong> va-


