Profil de pauvreté dans les pays de la CEDEAO - United Nations ...
Profil de pauvreté dans les pays de la CEDEAO - United Nations ...
Profil de pauvreté dans les pays de la CEDEAO - United Nations ...
Create successful ePaper yourself
Turn your PDF publications into a flip-book with our unique Google optimized e-Paper software.
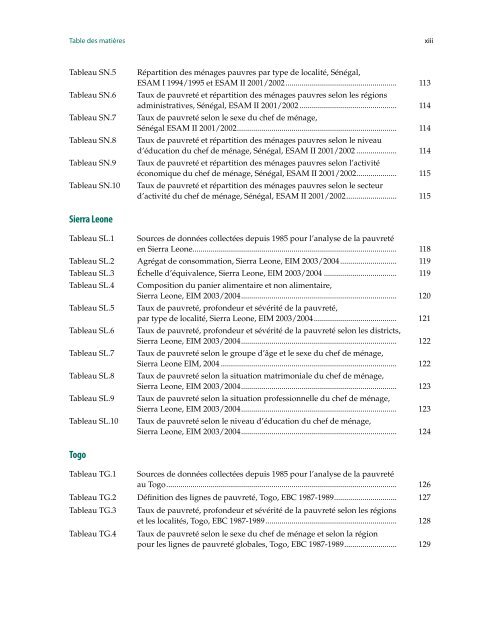
Table <strong>de</strong>s matières xiii<br />
Tableau SN.5 Répartition <strong>de</strong>s ménages pauvres par type <strong>de</strong> localité, Sénégal,<br />
ESAM I 1994/1995 et ESAM II 2001/2002 ....................................................... 113<br />
Tableau SN.6 Taux <strong>de</strong> <strong>pauvreté</strong> et répartition <strong>de</strong>s ménages pauvres selon <strong>les</strong> régions<br />
administratives, Sénégal, ESAM II 2001/2002 ................................................ 114<br />
Tableau SN.7 Taux <strong>de</strong> <strong>pauvreté</strong> selon le sexe du chef <strong>de</strong> ménage,<br />
Sénégal ESAM II 2001/2002 ............................................................................... 114<br />
Tableau SN.8 Taux <strong>de</strong> <strong>pauvreté</strong> et répartition <strong>de</strong>s ménages pauvres selon le niveau<br />
d’éducation du chef <strong>de</strong> ménage, Sénégal, ESAM II 2001/2002 .................... 114<br />
Tableau SN.9 Taux <strong>de</strong> <strong>pauvreté</strong> et répartition <strong>de</strong>s ménages pauvres selon l’activité<br />
économique du chef <strong>de</strong> ménage, Sénégal, ESAM II 2001/2002 .................... 115<br />
Tableau SN.10 Taux <strong>de</strong> <strong>pauvreté</strong> et répartition <strong>de</strong>s ménages pauvres selon le secteur<br />
d’activité du chef <strong>de</strong> ménage, Sénégal, ESAM II 2001/2002 ......................... 115<br />
Sierra Leone<br />
Tableau SL.1 Sources <strong>de</strong> données collectées <strong>de</strong>puis 1985 pour l’analyse <strong>de</strong> <strong>la</strong> <strong>pauvreté</strong><br />
en Sierra Leone ..................................................................................................... 118<br />
Tableau SL.2 Agrégat <strong>de</strong> consommation, Sierra Leone, EIM 2003/2004 ............................ 119<br />
Tableau SL.3 Échelle d’équivalence, Sierra Leone, EIM 2003/2004 .................................... 119<br />
Tableau SL.4 Composition du panier alimentaire et non alimentaire,<br />
Sierra Leone, EIM 2003/2004 ............................................................................. 120<br />
Tableau SL.5 Taux <strong>de</strong> <strong>pauvreté</strong>, profon<strong>de</strong>ur et sévérité <strong>de</strong> <strong>la</strong> <strong>pauvreté</strong>,<br />
par type <strong>de</strong> localité, Sierra Leone, EIM 2003/2004 ......................................... 121<br />
Tableau SL.6 Taux <strong>de</strong> <strong>pauvreté</strong>, profon<strong>de</strong>ur et sévérité <strong>de</strong> <strong>la</strong> <strong>pauvreté</strong> selon <strong>les</strong> districts,<br />
Sierra Leone, EIM 2003/2004 ............................................................................. 122<br />
Tableau SL.7 Taux <strong>de</strong> <strong>pauvreté</strong> selon le groupe d’âge et le sexe du chef <strong>de</strong> ménage,<br />
Sierra Leone EIM, 2004 ....................................................................................... 122<br />
Tableau SL.8 Taux <strong>de</strong> <strong>pauvreté</strong> selon <strong>la</strong> situation matrimoniale du chef <strong>de</strong> ménage,<br />
Sierra Leone, EIM 2003/2004 ............................................................................. 123<br />
Tableau SL.9 Taux <strong>de</strong> <strong>pauvreté</strong> selon <strong>la</strong> situation professionnelle du chef <strong>de</strong> ménage,<br />
Sierra Leone, EIM 2003/2004 ............................................................................. 123<br />
Tableau SL.10 Taux <strong>de</strong> <strong>pauvreté</strong> selon le niveau d’éducation du chef <strong>de</strong> ménage,<br />
Sierra Leone, EIM 2003/2004 ............................................................................. 124<br />
Togo<br />
Tableau TG.1 Sources <strong>de</strong> données collectées <strong>de</strong>puis 1985 pour l’analyse <strong>de</strong> <strong>la</strong> <strong>pauvreté</strong><br />
au Togo .................................................................................................................. 126<br />
Tableau TG.2 Définition <strong>de</strong>s lignes <strong>de</strong> <strong>pauvreté</strong>, Togo, EBC 1987-1989 ............................... 127<br />
Tableau TG.3 Taux <strong>de</strong> <strong>pauvreté</strong>, profon<strong>de</strong>ur et sévérité <strong>de</strong> <strong>la</strong> <strong>pauvreté</strong> selon <strong>les</strong> régions<br />
et <strong>les</strong> localités, Togo, EBC 1987-1989 ................................................................. 128<br />
Tableau TG.4 Taux <strong>de</strong> <strong>pauvreté</strong> selon le sexe du chef <strong>de</strong> ménage et selon <strong>la</strong> région<br />
pour <strong>les</strong> lignes <strong>de</strong> <strong>pauvreté</strong> globa<strong>les</strong>, Togo, EBC 1987-1989 .......................... 129


