Profil de pauvreté dans les pays de la CEDEAO - United Nations ...
Profil de pauvreté dans les pays de la CEDEAO - United Nations ...
Profil de pauvreté dans les pays de la CEDEAO - United Nations ...

You also want an ePaper? Increase the reach of your titles
YUMPU automatically turns print PDFs into web optimized ePapers that Google loves.
Aperçu 11<br />
vreté re<strong>la</strong>tives jusqu’en 1996, et en 2004 l’approche a été utilisée par souci <strong>de</strong> cohérence avec <strong>les</strong><br />
estimations précé<strong>de</strong>ntes. Les limites maxima<strong>les</strong> et minima<strong>les</strong> <strong>de</strong>s lignes <strong>de</strong> <strong>pauvreté</strong> re<strong>la</strong>tives ont<br />
été définies comme étant <strong>de</strong>ux tiers et un tiers respectivement <strong>de</strong>s dépenses moyennes nationa<strong>les</strong>.<br />
Au Nigéria, <strong>les</strong> lignes <strong>de</strong> <strong>pauvreté</strong> re<strong>la</strong>tives ont constitué <strong>la</strong> base <strong>de</strong> <strong>la</strong> plupart <strong>de</strong>s statistiques<br />
sur <strong>la</strong> <strong>pauvreté</strong>, et par conséquent <strong>la</strong> base <strong>de</strong> cet aperçu qui couvre l’ensemble du <strong>pays</strong>.<br />
<strong>Profil</strong>s <strong>de</strong> <strong>pauvreté</strong><br />
Dans <strong>la</strong> mesure où <strong>les</strong> métho<strong>de</strong>s <strong>de</strong> collecte <strong>de</strong> données et d’évaluation <strong>de</strong> <strong>la</strong> <strong>pauvreté</strong> sont différentes<br />
d’un <strong>pays</strong> à un autre et que <strong>les</strong> enquêtes auprès <strong>de</strong>s ménages n’ont pas été menées au même<br />
moment, cette partie du rapport fondée sur <strong>les</strong> estimations nationa<strong>les</strong> est d’utilisation limitée en<br />
termes <strong>de</strong> comparaison à travers <strong>les</strong> <strong>pays</strong>. Cependant, <strong>les</strong> taux <strong>de</strong> <strong>pauvreté</strong> 5 présentés mettent en<br />
lumière <strong>les</strong> caractéristiques communes <strong>dans</strong> <strong>les</strong> profils définis : évaluations nationa<strong>les</strong> <strong>de</strong> <strong>la</strong> <strong>pauvreté</strong><br />
et <strong>de</strong>s tendances <strong>de</strong> <strong>la</strong> <strong>pauvreté</strong>, catégories socioéconomiques <strong>de</strong>s popu<strong>la</strong>tions courant le<br />
risque <strong>de</strong> <strong>pauvreté</strong> le plus élevé. Ces informations sont uti<strong>les</strong> pour comprendre <strong>la</strong> <strong>pauvreté</strong> et ses<br />
implications <strong>dans</strong> <strong>les</strong> <strong>pays</strong> <strong>de</strong> <strong>la</strong> <strong>CEDEAO</strong>.<br />
Évaluation du niveau et <strong>de</strong>s tendances <strong>de</strong> <strong>la</strong> <strong>pauvreté</strong> au p<strong>la</strong>n national<br />
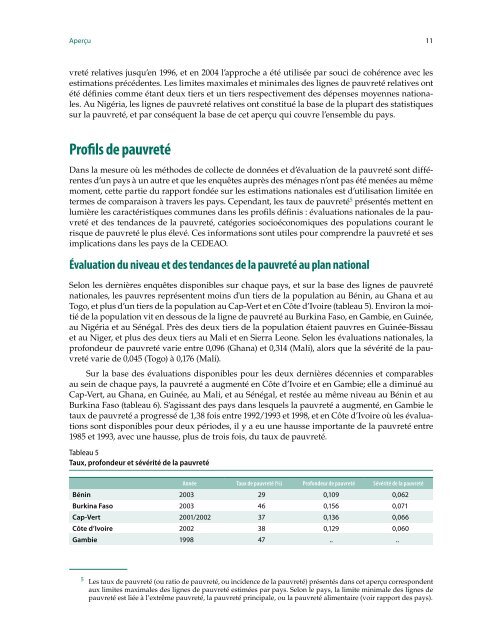
Selon <strong>les</strong> <strong>de</strong>rnières enquêtes disponib<strong>les</strong> sur chaque <strong>pays</strong>, et sur <strong>la</strong> base <strong>de</strong>s lignes <strong>de</strong> <strong>pauvreté</strong><br />
nationa<strong>les</strong>, <strong>les</strong> pauvres représentent moins d'un tiers <strong>de</strong> <strong>la</strong> popu<strong>la</strong>tion au Bénin, au Ghana et au<br />
Togo, et plus d’un tiers <strong>de</strong> <strong>la</strong> popu<strong>la</strong>tion au Cap-Vert et en Côte d’Ivoire (tableau 5). Environ <strong>la</strong> moitié<br />
<strong>de</strong> <strong>la</strong> popu<strong>la</strong>tion vit en <strong>de</strong>ssous <strong>de</strong> <strong>la</strong> ligne <strong>de</strong> <strong>pauvreté</strong> au Burkina Faso, en Gambie, en Guinée,<br />
au Nigéria et au Sénégal. Près <strong>de</strong>s <strong>de</strong>ux tiers <strong>de</strong> <strong>la</strong> popu<strong>la</strong>tion étaient pauvres en Guinée-Bissau<br />
et au Niger, et plus <strong>de</strong>s <strong>de</strong>ux tiers au Mali et en Sierra Leone. Selon <strong>les</strong> évaluations nationa<strong>les</strong>, <strong>la</strong><br />
profon<strong>de</strong>ur <strong>de</strong> <strong>pauvreté</strong> varie entre 0,096 (Ghana) et 0,314 (Mali), alors que <strong>la</strong> sévérité <strong>de</strong> <strong>la</strong> <strong>pauvreté</strong><br />
varie <strong>de</strong> 0,045 (Togo) à 0,176 (Mali).<br />
Sur <strong>la</strong> base <strong>de</strong>s évaluations disponib<strong>les</strong> pour <strong>les</strong> <strong>de</strong>ux <strong>de</strong>rnières décennies et comparab<strong>les</strong><br />
au sein <strong>de</strong> chaque <strong>pays</strong>, <strong>la</strong> <strong>pauvreté</strong> a augmenté en Côte d’Ivoire et en Gambie; elle a diminué au<br />
Cap-Vert, au Ghana, en Guinée, au Mali, et au Sénégal, et restée au même niveau au Bénin et au<br />
Burkina Faso (tableau 6). S’agissant <strong>de</strong>s <strong>pays</strong> <strong>dans</strong> <strong>les</strong>quels <strong>la</strong> <strong>pauvreté</strong> a augmenté, en Gambie le<br />
taux <strong>de</strong> <strong>pauvreté</strong> a progressé <strong>de</strong> 1,38 fois entre 1992/1993 et 1998, et en Côte d’Ivoire où <strong>les</strong> évaluations<br />
sont disponib<strong>les</strong> pour <strong>de</strong>ux pério<strong>de</strong>s, il y a eu une hausse importante <strong>de</strong> <strong>la</strong> <strong>pauvreté</strong> entre<br />
1985 et 1993, avec une hausse, plus <strong>de</strong> trois fois, du taux <strong>de</strong> <strong>pauvreté</strong>.<br />
Tableau 5<br />
Taux, profon<strong>de</strong>ur et sévérité <strong>de</strong> <strong>la</strong> <strong>pauvreté</strong><br />
Année Taux <strong>de</strong> <strong>pauvreté</strong> (%) Profon<strong>de</strong>ur <strong>de</strong> <strong>pauvreté</strong> Sévérité <strong>de</strong> <strong>la</strong> <strong>pauvreté</strong><br />
Bénin 2003 29 0,109 0,062<br />
Burkina Faso 2003 46 0,156 0,071<br />
Cap-Vert 2001/2002 37 0,136 0,066<br />
Côte d’Ivoire 2002 38 0,129 0,060<br />
Gambie 1998 47 .. ..<br />
5 Les taux <strong>de</strong> <strong>pauvreté</strong> (ou ratio <strong>de</strong> <strong>pauvreté</strong>, ou inci<strong>de</strong>nce <strong>de</strong> <strong>la</strong> <strong>pauvreté</strong>) présentés <strong>dans</strong> cet aperçu correspon<strong>de</strong>nt<br />
aux limites maxima<strong>les</strong> <strong>de</strong>s lignes <strong>de</strong> <strong>pauvreté</strong> estimées par <strong>pays</strong>. Selon le <strong>pays</strong>, <strong>la</strong> limite minimale <strong>de</strong>s lignes <strong>de</strong><br />
<strong>pauvreté</strong> est liée à l’extrême <strong>pauvreté</strong>, <strong>la</strong> <strong>pauvreté</strong> principale, ou <strong>la</strong> <strong>pauvreté</strong> alimentaire (voir rapport <strong>de</strong>s <strong>pays</strong>).