Profil de pauvreté dans les pays de la CEDEAO - United Nations ...
Profil de pauvreté dans les pays de la CEDEAO - United Nations ...
Profil de pauvreté dans les pays de la CEDEAO - United Nations ...

You also want an ePaper? Increase the reach of your titles
YUMPU automatically turns print PDFs into web optimized ePapers that Google loves.
114 <strong>Profil</strong> <strong>de</strong> <strong>pauvreté</strong> <strong>dans</strong> <strong>les</strong> <strong>pays</strong> <strong>de</strong> <strong>la</strong> <strong>CEDEAO</strong><br />
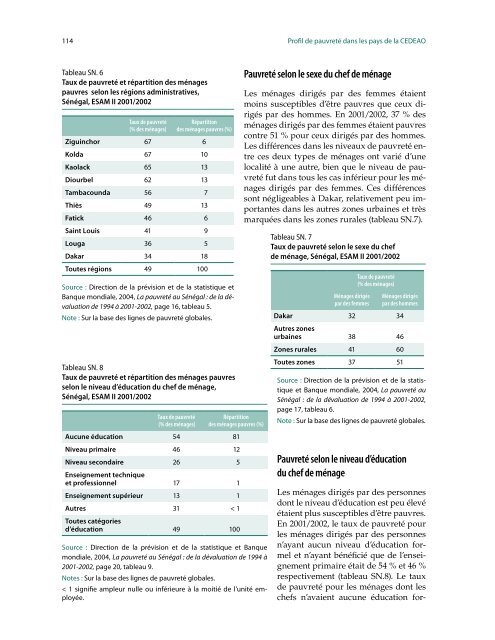
Tableau SN. 6<br />
Taux <strong>de</strong> <strong>pauvreté</strong> et répartition <strong>de</strong>s ménages<br />
pauvres selon <strong>les</strong> régions administratives,<br />
Sénégal, ESAM II 2001/2002<br />
Taux <strong>de</strong> <strong>pauvreté</strong><br />
(% <strong>de</strong>s ménages)<br />
Répartition<br />
<strong>de</strong>s ménages pauvres (%)<br />
Ziguinchor 67 6<br />
Kolda 67 10<br />
Kao<strong>la</strong>ck 65 13<br />
Diourbel 62 13<br />
Tambacounda 56 7<br />
Thiès 49 13<br />
Fatick 46 6<br />
Saint Louis 41 9<br />
Louga 36 5<br />
Dakar 34 18<br />
Toutes régions 49 100<br />
Source : Direction <strong>de</strong> <strong>la</strong> prévision et <strong>de</strong> <strong>la</strong> statistique et<br />
Ban que mondiale, 2004, La <strong>pauvreté</strong> au Sénégal : <strong>de</strong> <strong>la</strong> dévaluation<br />
<strong>de</strong> 1994 à 20012002, page 16, tableau 5.<br />
Note : Sur <strong>la</strong> base <strong>de</strong>s lignes <strong>de</strong> <strong>pauvreté</strong> globa<strong>les</strong>.<br />
Tableau SN. 8<br />
Taux <strong>de</strong> <strong>pauvreté</strong> et répartition <strong>de</strong>s ménages pauvres<br />
selon le niveau d’éducation du chef <strong>de</strong> ménage,<br />
Sénégal, ESAM II 2001/2002<br />
Taux <strong>de</strong> <strong>pauvreté</strong><br />
(% <strong>de</strong>s ménages)<br />
Répartition<br />
<strong>de</strong>s ménages pauvres (%)<br />
Aucune éducation 54 81<br />
Niveau primaire 46 12<br />
Niveau secondaire 26 5<br />
Enseignement technique<br />
et professionnel 17 1<br />
Enseignement supérieur 13 1<br />
Autres 31 < 1<br />
Toutes catégories<br />
d’éducation 49 100<br />
Source : Direction <strong>de</strong> <strong>la</strong> prévision et <strong>de</strong> <strong>la</strong> statistique et Banque<br />
mon diale, 2004, La <strong>pauvreté</strong> au Sénégal : <strong>de</strong> <strong>la</strong> dévaluation <strong>de</strong> 1994 à<br />
20012002, page 20, tableau 9.<br />
Notes : Sur <strong>la</strong> base <strong>de</strong>s lignes <strong>de</strong> <strong>pauvreté</strong> globa<strong>les</strong>.<br />
< 1 signifie ampleur nulle ou inférieure à <strong>la</strong> moitié <strong>de</strong> l’unité employée.<br />
Pauvreté selon le sexe du chef <strong>de</strong> ménage<br />
Les ménages dirigés par <strong>de</strong>s femmes étaient<br />
moins susceptib<strong>les</strong> d’être pauvres que ceux dirigés<br />
par <strong>de</strong>s hommes. En 2001/2002, 37 % <strong>de</strong>s<br />
ménages dirigés par <strong>de</strong>s femmes étaient pauvres<br />
contre 51 % pour ceux dirigés par <strong>de</strong>s hommes.<br />
Les différences <strong>dans</strong> <strong>les</strong> niveaux <strong>de</strong> <strong>pauvreté</strong> entre<br />
ces <strong>de</strong>ux types <strong>de</strong> ménages ont varié d’une<br />
localité à une autre, bien que le niveau <strong>de</strong> <strong>pauvreté</strong><br />
fut <strong>dans</strong> tous <strong>les</strong> cas inférieur pour <strong>les</strong> ménages<br />
dirigés par <strong>de</strong>s femmes. Ces différences<br />
sont négligeab<strong>les</strong> à Dakar, re<strong>la</strong>tivement peu importantes<br />
<strong>dans</strong> <strong>les</strong> autres zones urbaines et très<br />
marquées <strong>dans</strong> <strong>les</strong> zones rura<strong>les</strong> (tableau SN.7).<br />
Tableau SN. 7<br />
Taux <strong>de</strong> <strong>pauvreté</strong> selon le sexe du chef<br />
<strong>de</strong> ménage, Sénégal, ESAM II 2001/2002<br />
Ménages dirigés<br />
par <strong>de</strong>s femmes<br />
Taux <strong>de</strong> <strong>pauvreté</strong><br />
(% <strong>de</strong>s ménages)<br />
Ménages dirigés<br />
par <strong>de</strong>s hommes<br />
Dakar 32 34<br />
Autres zones<br />
urbaines 38 46<br />
Zones rura<strong>les</strong> 41 60<br />
Toutes zones 37 51<br />
Source : Direction <strong>de</strong> <strong>la</strong> prévision et <strong>de</strong> <strong>la</strong> statistique<br />
et Banque mondiale, 2004, La <strong>pauvreté</strong> au<br />
Sénégal : <strong>de</strong> <strong>la</strong> dévaluation <strong>de</strong> 1994 à 20012002,<br />
page 17, tableau 6.<br />
Note : Sur <strong>la</strong> base <strong>de</strong>s lignes <strong>de</strong> <strong>pauvreté</strong> globa<strong>les</strong>.<br />
Pauvreté selon le niveau d’éducation<br />
du chef <strong>de</strong> ménage<br />
Les ménages dirigés par <strong>de</strong>s personnes<br />
dont le niveau d’éducation est peu élevé<br />
étaient plus susceptib<strong>les</strong> d’être pauvres.<br />
En 2001/2002, le taux <strong>de</strong> <strong>pauvreté</strong> pour<br />
<strong>les</strong> ménages dirigés par <strong>de</strong>s personnes<br />
n’ayant aucun niveau d’éducation formel<br />
et n’ayant bénéficié que <strong>de</strong> l’enseignement<br />
primaire était <strong>de</strong> 54 % et 46 %<br />
respectivement (tableau SN.8). Le taux<br />
<strong>de</strong> <strong>pauvreté</strong> pour <strong>les</strong> ménages dont <strong>les</strong><br />
chefs n’avaient aucune éducation for-