Profil de pauvreté dans les pays de la CEDEAO - United Nations ...
Profil de pauvreté dans les pays de la CEDEAO - United Nations ...
Profil de pauvreté dans les pays de la CEDEAO - United Nations ...
Create successful ePaper yourself
Turn your PDF publications into a flip-book with our unique Google optimized e-Paper software.
56 <strong>Profil</strong> <strong>de</strong> <strong>pauvreté</strong> <strong>dans</strong> <strong>les</strong> <strong>pays</strong> <strong>de</strong> <strong>la</strong> <strong>CEDEAO</strong><br />
Suite aux <strong>de</strong>rniers points <strong>de</strong> vues exprimés par le <strong>pays</strong> sur <strong>la</strong> base du SPA II <strong>de</strong> 2002, <strong>les</strong> statistiques<br />
<strong>de</strong> <strong>pauvreté</strong> pour le compte <strong>de</strong> l’exercice 1998 utilisées <strong>dans</strong> le profil sont basées sur <strong>les</strong><br />
lignes <strong>de</strong> 1992/1993 ajustées pour prendre en compte <strong>les</strong> changements <strong>de</strong>s prix.<br />
<strong>Profil</strong> <strong>de</strong> <strong>pauvreté</strong><br />
Pauvreté par type <strong>de</strong> localité<br />
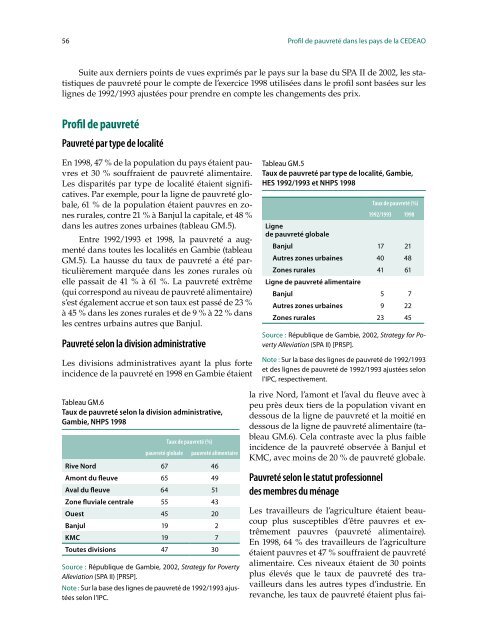
En 1998, 47 % <strong>de</strong> <strong>la</strong> popu<strong>la</strong>tion du <strong>pays</strong> étaient pauvres<br />
et 30 % souffraient <strong>de</strong> <strong>pauvreté</strong> alimentaire.<br />
Les disparités par type <strong>de</strong> localité étaient significatives.<br />
Par exemple, pour <strong>la</strong> ligne <strong>de</strong> <strong>pauvreté</strong> globale,<br />
61 % <strong>de</strong> <strong>la</strong> popu<strong>la</strong>tion étaient pauvres en zones<br />
rura<strong>les</strong>, contre 21 % à Banjul <strong>la</strong> capitale, et 48 %<br />
<strong>dans</strong> <strong>les</strong> autres zones urbaines (tableau GM.5).<br />
Entre 1992/1993 et 1998, <strong>la</strong> <strong>pauvreté</strong> a augmenté<br />
<strong>dans</strong> toutes <strong>les</strong> localités en Gambie (tableau<br />
GM.5). La hausse du taux <strong>de</strong> <strong>pauvreté</strong> a été particulièrement<br />
marquée <strong>dans</strong> <strong>les</strong> zones rura<strong>les</strong> où<br />
elle passait <strong>de</strong> 41 % à 61 %. La <strong>pauvreté</strong> extrême<br />
(qui correspond au niveau <strong>de</strong> <strong>pauvreté</strong> alimentaire)<br />
s’est également accrue et son taux est passé <strong>de</strong> 23 %<br />
à 45 % <strong>dans</strong> <strong>les</strong> zones rura<strong>les</strong> et <strong>de</strong> 9 % à 22 % <strong>dans</strong><br />
<strong>les</strong> centres urbains autres que Banjul.<br />
Pauvreté selon <strong>la</strong> division administrative<br />
Les divisions administratives ayant <strong>la</strong> plus forte<br />
inci<strong>de</strong>nce <strong>de</strong> <strong>la</strong> <strong>pauvreté</strong> en 1998 en Gambie étaient<br />
Tableau GM.6<br />
Taux <strong>de</strong> <strong>pauvreté</strong> selon <strong>la</strong> division administrative,<br />
Gambie, NHPS 1998<br />
Taux <strong>de</strong> <strong>pauvreté</strong> (%)<br />
<strong>pauvreté</strong> globale <strong>pauvreté</strong> alimentaire<br />
Rive Nord 67 46<br />
Amont du fleuve 65 49<br />
Aval du fleuve 64 51<br />
Zone fluviale centrale 55 43<br />
Ouest 45 20<br />
Banjul 19 2<br />
KMC 19 7<br />
Toutes divisions 47 30<br />
Source : République <strong>de</strong> Gambie, 2002, Strategy for Poverty<br />
Alleviation (SPA II) [PRSP].<br />
Note : Sur <strong>la</strong> base <strong>de</strong>s lignes <strong>de</strong> <strong>pauvreté</strong> <strong>de</strong> 1992/1993 ajustées<br />
selon l’IPC.<br />
Tableau GM.5<br />
Taux <strong>de</strong> <strong>pauvreté</strong> par type <strong>de</strong> localité, Gambie,<br />
HES 1992/1993 et NHPS 1998<br />
<strong>la</strong> rive Nord, l’amont et l’aval du fleuve avec à<br />
peu près <strong>de</strong>ux tiers <strong>de</strong> <strong>la</strong> popu<strong>la</strong>tion vivant en<br />
<strong>de</strong>ssous <strong>de</strong> <strong>la</strong> ligne <strong>de</strong> <strong>pauvreté</strong> et <strong>la</strong> moitié en<br />
<strong>de</strong>ssous <strong>de</strong> <strong>la</strong> ligne <strong>de</strong> <strong>pauvreté</strong> alimentaire (tableau<br />
GM.6). Ce<strong>la</strong> contraste avec <strong>la</strong> plus faible<br />
inci<strong>de</strong>nce <strong>de</strong> <strong>la</strong> <strong>pauvreté</strong> observée à Banjul et<br />
KMC, avec moins <strong>de</strong> 20 % <strong>de</strong> <strong>pauvreté</strong> globale.<br />
Pauvreté selon le statut professionnel<br />
<strong>de</strong>s membres du ménage<br />
Taux <strong>de</strong> <strong>pauvreté</strong> (%)<br />
1992/1993 1998<br />
Ligne<br />
<strong>de</strong> <strong>pauvreté</strong> globale<br />
Banjul 17 21<br />
Autres zones urbaines 40 48<br />
Zones rura<strong>les</strong><br />
Ligne <strong>de</strong> <strong>pauvreté</strong> alimentaire<br />
41 61<br />
Banjul 5 7<br />
Autres zones urbaines 9 22<br />
Zones rura<strong>les</strong> 23 45<br />
Source : République <strong>de</strong> Gambie, 2002, Strategy for Poverty<br />
Alleviation (SPA II) [PRSP].<br />
Note : Sur <strong>la</strong> base <strong>de</strong>s lignes <strong>de</strong> <strong>pauvreté</strong> <strong>de</strong> 1992/1993<br />
et <strong>de</strong>s lignes <strong>de</strong> <strong>pauvreté</strong> <strong>de</strong> 1992/1993 ajustées selon<br />
l’IPC, respectivement.<br />
Les travailleurs <strong>de</strong> l’agriculture étaient beaucoup<br />
plus susceptib<strong>les</strong> d’être pauvres et extrêmement<br />
pauvres (<strong>pauvreté</strong> alimentaire).<br />
En 1998, 64 % <strong>de</strong>s travailleurs <strong>de</strong> l’agriculture<br />
étaient pauvres et 47 % souffraient <strong>de</strong> <strong>pauvreté</strong><br />
alimentaire. Ces niveaux étaient <strong>de</strong> 30 points<br />
plus élevés que le taux <strong>de</strong> <strong>pauvreté</strong> <strong>de</strong>s travailleurs<br />
<strong>dans</strong> <strong>les</strong> autres types d’industrie. En<br />
revanche, <strong>les</strong> taux <strong>de</strong> <strong>pauvreté</strong> étaient plus fai-


