Plano Territorial de Desenvolvimento do Médio Tejo e Pinhal ...
Plano Territorial de Desenvolvimento do Médio Tejo e Pinhal ...
Plano Territorial de Desenvolvimento do Médio Tejo e Pinhal ...

You also want an ePaper? Increase the reach of your titles
YUMPU automatically turns print PDFs into web optimized ePapers that Google loves.
PARTE I – COMPETITIVIDADE E COESÃO TERRITORIAL DO MÉDIO TEJO E<br />
PINHAL INTERIOR SUL: DIAGNÓSTICO PROSPECTIVO<br />
As regiões <strong>Médio</strong> <strong>Tejo</strong> e <strong>Pinhal</strong> Interior Sul representam, no seu conjunto, cerca <strong>de</strong> 11% a<br />
12% da população resi<strong>de</strong>nte, das unida<strong>de</strong>s empresariais e <strong>do</strong> número <strong>de</strong> postos <strong>de</strong><br />
trabalho gera<strong>do</strong>s na região Centro <strong>de</strong> Portugal. Estabelece-se entre as duas regiões NUTS<br />
III uma notória discrepância dimensional, em que o <strong>Médio</strong> <strong>Tejo</strong> respon<strong>de</strong> por cerca <strong>de</strong><br />
10% e o <strong>Pinhal</strong> Interior Sul por cerca <strong>de</strong> 2% daqueles gran<strong>de</strong>s números. Esta diferença <strong>de</strong><br />
dimensões é acompanhada, também, por diferenças expressivas ao nível <strong>do</strong> mo<strong>de</strong>lo <strong>de</strong><br />
povoamento característico <strong>de</strong> cada uma <strong>de</strong>las, com o <strong>Pinhal</strong> Interior Sul a apresentar<br />
uma dispersão populacional bastante mais elevada (o <strong>Pinhal</strong> Interior Sul cobre uma área<br />
equivalente a cerca <strong>de</strong> 80% da área <strong>do</strong> <strong>Médio</strong> <strong>Tejo</strong> e a sua população resi<strong>de</strong>nte não<br />
chega a atingir os 20% <strong>do</strong> <strong>Médio</strong> <strong>Tejo</strong>).<br />
O nível <strong>de</strong> vida atingi<strong>do</strong> no contexto agrega<strong>do</strong> das duas regiões alinha com o nível<br />
médio da região Centro (igualan<strong>do</strong> o seu valor <strong>de</strong> PIB per capita), fican<strong>do</strong>, contu<strong>do</strong>,<br />
abaixo <strong>do</strong> nível médio <strong>de</strong> vida nacional em cerca <strong>de</strong> 14 p.p.. Esta posição globalmente<br />
equilibrada no contexto da região Centro, quan<strong>do</strong> medida em termos <strong>de</strong> nível médio <strong>de</strong><br />
vida, <strong>de</strong>grada-se quan<strong>do</strong> se usa como referencial o rendimento disponível da população<br />
resi<strong>de</strong>nte, que correspon<strong>de</strong>, nos concelhos <strong>do</strong> <strong>Médio</strong> <strong>Tejo</strong> e <strong>do</strong> <strong>Pinhal</strong> Interior Sul, a cerca<br />
<strong>de</strong> 83% <strong>do</strong> patamar médio da região Centro e a 63% <strong>do</strong> patamar médio nacional.<br />
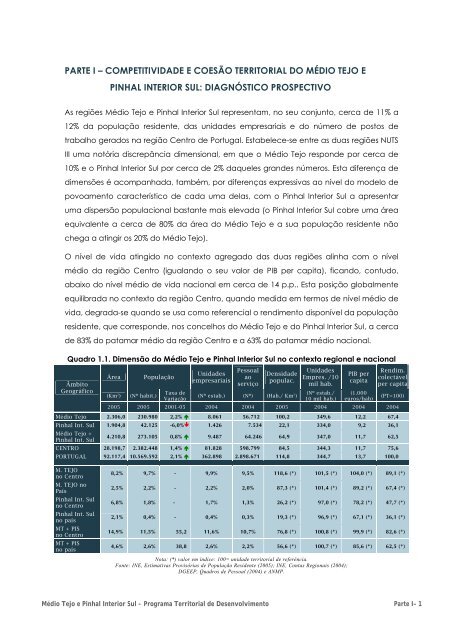
Quadro 1.1. Dimensão <strong>do</strong> <strong>Médio</strong> <strong>Tejo</strong> e <strong>Pinhal</strong> Interior Sul no contexto regional e nacional<br />
Âmbito<br />
Geográfico<br />
Área População<br />
(Km 2 ) (Nº habit.)<br />
Taxa <strong>de</strong><br />
Variação<br />
Unida<strong>de</strong>s<br />
empresariais<br />
Pessoal<br />
ao<br />
serviço<br />
Densida<strong>de</strong><br />
populac.<br />
(Nº estab.) (Nº) (Hab./ Km 2 )<br />
Unida<strong>de</strong>s<br />
Empres. /10<br />
mil hab.<br />
(Nº estab./<br />
10 mil hab.)<br />
PIB per<br />
capita<br />
(1.000<br />
euros/hab)<br />
Rendim.<br />
colectável<br />
per capita<br />
(PT=100)<br />
2005 2005 2001-05 2004 2004 2005 2004 2004 2004<br />
<strong>Médio</strong> <strong>Tejo</strong> 2.306,0 230.980 2,2% 8.061 56.712 100,2 349,6 12,2 67,4<br />
<strong>Pinhal</strong> Int. Sul 1.904,8 42.125 -6,0% 1.426 7.534 22,1 334,0 9,2 36,1<br />
<strong>Médio</strong> <strong>Tejo</strong> +<br />
<strong>Pinhal</strong> Int. Sul<br />
4.210,8 273.105 0,8% 9.487 64.246 64,9 347,0 11,7 62,5<br />
CENTRO 28.198,7 2.382.448 1,4% 81.828 598.799 84,5 344,3 11,7 75,6<br />
PORTUGAL 92.117,4 10.569.592 2,1% 362.898 2.898.671 114,8 344,7 13,7 100,0<br />
M. TEJO<br />
no Centro<br />
M. TEJO no<br />
País<br />
<strong>Pinhal</strong> Int. Sul<br />
no Centro<br />
<strong>Pinhal</strong> Int. Sul<br />
no país<br />
MT + PIS<br />
no Centro<br />
MT + PIS<br />
no país<br />
8,2% 9,7% - 9,9% 9,5% 118,6 (*) 101,5 (*) 104,0 (*) 89,1 (*)<br />
2,5% 2,2% - 2,2% 2,0% 87,3 (*) 101,4 (*) 89,2 (*) 67,4 (*)<br />
6,8% 1,8% - 1,7% 1,3% 26,2 (*) 97,0 (*) 78,2 (*) 47,7 (*)<br />
2,1% 0,4% - 0,4% 0,3% 19,3 (*) 96,9 (*) 67,1 (*) 36,1 (*)<br />
14,9% 11,5% 55,2 11,6% 10,7% 76,8 (*) 100,8 (*) 99,9 (*) 82,6 (*)<br />
4,6% 2,6% 38,8 2,6% 2,2% 56,6 (*) 100,7 (*) 85,6 (*) 62,5 (*)<br />
Nota: (*) valor em índice: 100= unida<strong>de</strong> territorial <strong>de</strong> referência.<br />
Fonte: INE, Estimativas Provisórias <strong>de</strong> População Resi<strong>de</strong>nte (2005); INE, Contas Regionais (2004);<br />
DGEEP, Quadros <strong>de</strong> Pessoal (2004) e ANMP.<br />
<strong>Médio</strong> <strong>Tejo</strong> e <strong>Pinhal</strong> Interior Sul - Programa <strong>Territorial</strong> <strong>de</strong> <strong>Desenvolvimento</strong> Parte I– 1