Plano Territorial de Desenvolvimento do Médio Tejo e Pinhal ...
Plano Territorial de Desenvolvimento do Médio Tejo e Pinhal ...
Plano Territorial de Desenvolvimento do Médio Tejo e Pinhal ...

You also want an ePaper? Increase the reach of your titles
YUMPU automatically turns print PDFs into web optimized ePapers that Google loves.
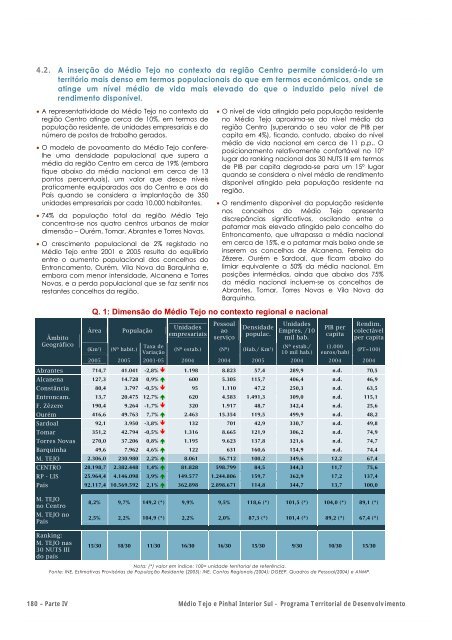
4.2. A inserção <strong>do</strong> <strong>Médio</strong> <strong>Tejo</strong> no contexto da região Centro permite consi<strong>de</strong>rá-lo um<br />
território mais <strong>de</strong>nso em termos populacionais <strong>do</strong> que em termos económicos, on<strong>de</strong> se<br />
atinge um nível médio <strong>de</strong> vida mais eleva<strong>do</strong> <strong>do</strong> que o induzi<strong>do</strong> pelo nível <strong>de</strong><br />
rendimento disponível.<br />
• A representativida<strong>de</strong> <strong>do</strong> <strong>Médio</strong> <strong>Tejo</strong> no contexto da<br />
região Centro atinge cerca <strong>de</strong> 10%, em termos <strong>de</strong><br />
população resi<strong>de</strong>nte, <strong>de</strong> unida<strong>de</strong>s empresariais e <strong>do</strong><br />
número <strong>de</strong> postos <strong>de</strong> trabalho gera<strong>do</strong>s.<br />
• O mo<strong>de</strong>lo <strong>de</strong> povoamento <strong>do</strong> <strong>Médio</strong> <strong>Tejo</strong> conferelhe<br />
uma <strong>de</strong>nsida<strong>de</strong> populacional que supera a<br />
média da região Centro em cerca <strong>de</strong> 19% (embora<br />
fique abaixo da média nacional em cerca <strong>de</strong> 13<br />
pontos percentuais), um valor que <strong>de</strong>sce níveis<br />
praticamente equipara<strong>do</strong>s aos <strong>do</strong> Centro e aos <strong>do</strong><br />
País quan<strong>do</strong> se consi<strong>de</strong>ra a implantação <strong>de</strong> 350<br />
unida<strong>de</strong>s empresariais por cada 10.000 habitantes.<br />
• 74% da população total da região <strong>Médio</strong> <strong>Tejo</strong><br />
concentra-se nos quatro centros urbanos <strong>de</strong> maior<br />
dimensão – Ourém, Tomar, Abrantes e Torres Novas.<br />
• O crescimento populacional <strong>de</strong> 2% regista<strong>do</strong> no<br />
<strong>Médio</strong> <strong>Tejo</strong> entre 2001 e 2005 resulta <strong>do</strong> equilíbrio<br />
entre o aumento populacional <strong>do</strong>s concelhos <strong>do</strong><br />
Entroncamento, Ourém, Vila Nova da Barquinha e,<br />
embora com menor intensida<strong>de</strong>, Alcanena e Torres<br />
Novas, e a perda populacional que se faz sentir nos<br />
restantes concelhos da região.<br />
Âmbito<br />
Geográfico<br />
• O nível <strong>de</strong> vida atingi<strong>do</strong> pela população resi<strong>de</strong>nte<br />
no <strong>Médio</strong> <strong>Tejo</strong> aproxima-se <strong>do</strong> nível médio da<br />
região Centro (superan<strong>do</strong> o seu valor <strong>de</strong> PIB per<br />
capita em 4%), fican<strong>do</strong>, contu<strong>do</strong>, abaixo <strong>do</strong> nível<br />
médio <strong>de</strong> vida nacional em cerca <strong>de</strong> 11 p.p.. O<br />
posicionamento relativamente confortável no 10º<br />
lugar <strong>do</strong> ranking nacional das 30 NUTS III em termos<br />
<strong>de</strong> PIB per capita <strong>de</strong>grada-se para um 15º lugar<br />
quan<strong>do</strong> se consi<strong>de</strong>ra o nível médio <strong>de</strong> rendimento<br />
disponível atingi<strong>do</strong> pela população resi<strong>de</strong>nte na<br />
região.<br />
• O rendimento disponível da população resi<strong>de</strong>nte<br />
nos concelhos <strong>do</strong> <strong>Médio</strong> <strong>Tejo</strong> apresenta<br />
discrepâncias significativas, oscilan<strong>do</strong> entre o<br />
patamar mais eleva<strong>do</strong> atingi<strong>do</strong> pelo concelho <strong>do</strong><br />
Entroncamento, que ultrapassa a média nacional<br />
em cerca <strong>de</strong> 15%, e o patamar mais baixo on<strong>de</strong> se<br />
inserem os concelhos <strong>de</strong> Alcanena, Ferreira <strong>do</strong><br />
Zêzere, Ourém e Sar<strong>do</strong>al, que ficam abaixo <strong>do</strong><br />
limiar equivalente a 50% da média nacional. Em<br />
posições intermédias, ainda que abaixo <strong>do</strong>s 75%<br />
da média nacional incluem-se os concelhos <strong>de</strong><br />
Abrantes, Tomar, Torres Novas e Vila Nova da<br />
Barquinha.<br />
Q. 1: Dimensão <strong>do</strong> <strong>Médio</strong> <strong>Tejo</strong> no contexto regional e nacional<br />
Área População<br />
(Km 2 ) (Nº habit.)<br />
Taxa <strong>de</strong><br />
Variação<br />
Unida<strong>de</strong>s<br />
empresariais<br />
Pessoal<br />
ao<br />
serviço<br />
Densida<strong>de</strong><br />
populac.<br />
(Nº estab.) (Nº) (Hab./ Km 2 )<br />
Unida<strong>de</strong>s<br />
Empres. /10<br />
mil hab.<br />
(Nº estab./<br />
10 mil hab.)<br />
PIB per<br />
capita<br />
(1.000<br />
euros/hab)<br />
Rendim.<br />
colectável<br />
per capita<br />
(PT=100)<br />
2005 2005 2001-05 2004 2004 2005 2004 2004 2004<br />
Abrantes 714,7 41.041 -2,8% 1.198 8.823 57,4 289,9 n.d. 70,5<br />
Alcanena 127,3 14.728 0,9% 600 5.305 115,7 406,4 n.d. 46,9<br />
Constância 80,4 3.797 -0,5% 95 1.110 47,2 250,3 n.d. 63,5<br />
Entroncam. 13,7 20.475 12,7% 620 4.583 1.491,3 309,0 n.d. 115,1<br />
F. Zêzere 190,4 9.264 -1,7% 320 1.917 48,7 342,4 n.d. 25,6<br />
Ourém 416,6 49.763 7,7% 2.463 15.354 119,5 499,9 n.d. 48,2<br />
Sar<strong>do</strong>al 92,1 3.950 -3,8% 132 701 42,9 330,7 n.d. 49,8<br />
Tomar 351,2 42.794 -0,5% 1.316 8.665 121,9 306,2 n.d. 74,9<br />
Torres Novas 270,0 37.206 0,8% 1.195 9.623 137,8 321,6 n.d. 74,7<br />
Barquinha 49,6 7.962 4,6% 122 631 160,6 154,9 n.d. 74,4<br />
M. TEJO 2.306,0 230.980 2,2% 8.061 56.712 100,2 349,6 12,2 67,4<br />
CENTRO 28.198,7 2.382.448 1,4% 81.828 598.799 84,5 344,3 11,7 75,6<br />
RP - LIS 25.964,4 4.146.098 3,9% 149.577 1.244.806 159,7 362,9 17,2 137,4<br />
País 92.117,4 10.569.592 2,1% 362.898 2.898.671 114,8 344,7 13,7 100,0<br />
M. TEJO<br />
no Centro<br />
M. TEJO no<br />
País<br />
Ranking:<br />
M. TEJO nas<br />
30 NUTS III<br />
<strong>do</strong> país<br />
8,2% 9,7% 149,2 (*) 9,9% 9,5% 118,6 (*) 101,5 (*) 104,0 (*) 89,1 (*)<br />
2,5% 2,2% 104,9 (*) 2,2% 2,0% 87,3 (*) 101,4 (*) 89,2 (*) 67,4 (*)<br />
15/30 18/30 11/30 16/30 16/30 15/30 9/30 10/30 15/30<br />
Nota: (*) valor em índice: 100= unida<strong>de</strong> territorial <strong>de</strong> referência.<br />
Fonte: INE, Estimativas Provisórias <strong>de</strong> População Resi<strong>de</strong>nte (2005); INE, Contas Regionais (2004); DGEEP, Quadros <strong>de</strong> Pessoal(2004) e ANMP.<br />
180 – Parte IV <strong>Médio</strong> <strong>Tejo</strong> e <strong>Pinhal</strong> Interior Sul - Programa <strong>Territorial</strong> <strong>de</strong> <strong>Desenvolvimento</strong>