Plano Territorial de Desenvolvimento do Médio Tejo e Pinhal ...
Plano Territorial de Desenvolvimento do Médio Tejo e Pinhal ...
Plano Territorial de Desenvolvimento do Médio Tejo e Pinhal ...

You also want an ePaper? Increase the reach of your titles
YUMPU automatically turns print PDFs into web optimized ePapers that Google loves.
4.50. A estrutura <strong>de</strong> habilitações da população activa resi<strong>de</strong>nte no <strong>Médio</strong> <strong>Tejo</strong> encontra-se<br />
alinhada com os valores <strong>de</strong> referência nacionais embora com maiores e, ainda assim<br />
ligeiras diferenças, nos níveis mais eleva<strong>do</strong>s <strong>de</strong> instrução (ensino secundário<br />
complementar e ensino médio e superior).<br />
G. 35: Habilitações da população activa<br />
resi<strong>de</strong>nte, 2001<br />
Abrantes<br />
Alcanena<br />
Constância<br />
Entroncamento<br />
F. Zêzere<br />
Ourém<br />
Sar<strong>do</strong>al<br />
Tomar<br />
Torres Novas<br />
Barquinha<br />
M. TEJO<br />
CENTRO<br />
RP-LIS<br />
PORTUGAL<br />
17%<br />
30%<br />
33%<br />
30%<br />
33%<br />
29%<br />
28%<br />
26%<br />
30%<br />
33%<br />
26%<br />
35%<br />
31%<br />
43%<br />
22%<br />
28%<br />
29%<br />
24%<br />
28%<br />
27%<br />
30%<br />
31%<br />
29%<br />
30%<br />
29%<br />
35%<br />
35%<br />
40%<br />
34%<br />
27%<br />
26%<br />
26%<br />
27%<br />
29%<br />
26%<br />
25%<br />
20%<br />
22%<br />
25%<br />
18%<br />
17%<br />
25%<br />
16%<br />
14%<br />
16%<br />
16%<br />
15%<br />
14%<br />
14%<br />
21%<br />
11%<br />
11%<br />
10%<br />
16%<br />
0% 20% 40% 60% 80% 100%<br />
% pop. sem nível <strong>de</strong> ensino % pop. 1º ciclo <strong>do</strong> Ens. Básico<br />
% pop. 2º e 3º ciclo % pop. ensino sec. Complementar<br />
% pop. ensino médio e superior<br />
Fonte: INE, Censos 2001<br />
5%<br />
8%<br />
• A heterogeneida<strong>de</strong> concelhia no <strong>Médio</strong> <strong>Tejo</strong> é<br />
notória, observan<strong>do</strong>-se diversas combinações<br />
<strong>de</strong> estrutura <strong>de</strong> habilitações <strong>de</strong> população<br />
activa.<br />
• Os concelhos <strong>do</strong> Entroncamento e Ferreira <strong>do</strong><br />
Zêzere representam os extremos <strong>de</strong>stas<br />
estruturas <strong>de</strong> habilitações assinalavelmente<br />
divergente:<br />
No Entroncamento 17% da população<br />
activa completou apenas o 1º ciclo e 25%<br />
apresentam níveis <strong>de</strong> instrução médio e<br />
superior enquanto em Ferreira <strong>do</strong> Zêzere<br />
esses valores alcançam os 43% e 5%,<br />
respectivamente;<br />
No Entroncamento a fatia da população<br />
remanescente distribui-se, maioritariamente,<br />
no nível secundário complementar (35%)<br />
enquanto que em Ferreira <strong>do</strong> Zêzere essa<br />
posição é ocupada pelo 2º e 3º ciclo <strong>do</strong><br />
ensino básico;<br />
• Os concelhos <strong>do</strong> Sar<strong>do</strong>al e Ourém revelam uma<br />
estrutura <strong>de</strong> habilitações mo<strong>de</strong>radamente<br />
próxima <strong>de</strong> Ferreira <strong>do</strong> Zêzere.<br />
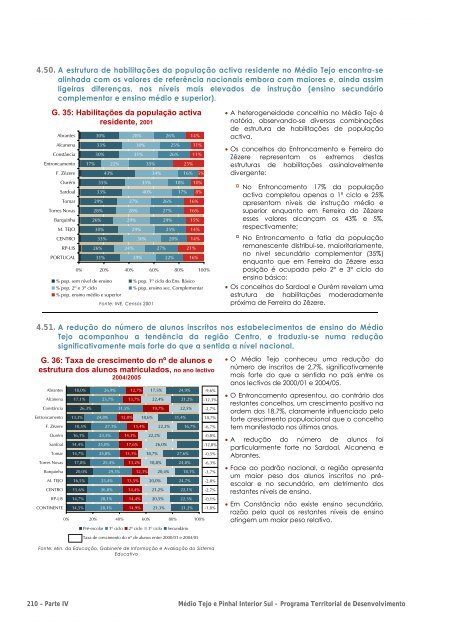
4.51. A redução <strong>do</strong> número <strong>de</strong> alunos inscritos nos estabelecimentos <strong>de</strong> ensino <strong>do</strong> <strong>Médio</strong><br />
<strong>Tejo</strong> acompanhou a tendência da região Centro, e traduziu-se numa redução<br />
significativamente mais forte <strong>do</strong> que a sentida a nível nacional.<br />
G. 36: Taxa <strong>de</strong> crescimento <strong>do</strong> nº <strong>de</strong> alunos e<br />
estrutura <strong>do</strong>s alunos matricula<strong>do</strong>s, no ano lectivo<br />
2004/2005<br />
Abrantes<br />
Alcanena<br />
Constância<br />
Entroncamento<br />
F. Zêzere<br />
Ourém<br />
Sar<strong>do</strong>al<br />
Tomar<br />
Torres Novas<br />
Barquinha<br />
M. TEJO<br />
CENTRO<br />
RP-LIS<br />
CONTINENTE<br />
18,0%<br />
17,1%<br />
13,3%<br />
18,5%<br />
16,1%<br />
14,4%<br />
14,7%<br />
17,8%<br />
20,0%<br />
16,5%<br />
15,6%<br />
14,7%<br />
14,5%<br />
26,3%<br />
25,7%<br />
24,8%<br />
23,3%<br />
25,0%<br />
26,9%<br />
25,8%<br />
27,1%<br />
25,4%<br />
25,4%<br />
26,8%<br />
28,1%<br />
28,1%<br />
29,3%<br />
31,5%<br />
12,0%<br />
13,7%<br />
14,3%<br />
12,7%<br />
17,6%<br />
13,1%<br />
13,2%<br />
13,5%<br />
15,4%<br />
14,4%<br />
14,4%<br />
14,9%<br />
18,6%<br />
12,1%<br />
17,5%<br />
18,7%<br />
22,4%<br />
19,7%<br />
22,2%<br />
18,8%<br />
20,0%<br />
26,0%<br />
20,4%<br />
21,2%<br />
20,5%<br />
22,2%<br />
21,3%<br />
24,9%<br />
31,4%<br />
21,2%<br />
22,5%<br />
27,6%<br />
16,7%<br />
24,8%<br />
18,1%<br />
24,7%<br />
22,1%<br />
22,3%<br />
21,2%<br />
0% 20% 40% 60% 80% 100%<br />
Pré-escolar 1º ciclo 2º ciclo 3º ciclo Secundário<br />
Taxa <strong>de</strong> crescimento <strong>do</strong> nº <strong>de</strong> alunos entre 2000/01 e 2004/05<br />
-9,6%<br />
-12,3%<br />
-2,7%<br />
18,7%<br />
-6,7%<br />
-0,8%<br />
-12,8%<br />
-0,5%<br />
-6,3%<br />
-3,7%<br />
-2,8%<br />
-2,7%<br />
-0,1%<br />
-1,8%<br />
Fonte: Min. da Educação, Gabinete <strong>de</strong> Informação e Avaliação <strong>do</strong> Sistema<br />
Educativo<br />
• O <strong>Médio</strong> <strong>Tejo</strong> conheceu uma redução <strong>do</strong><br />
número <strong>de</strong> inscritos <strong>de</strong> 2,7%, significativamente<br />
mais forte <strong>do</strong> que a sentida no país entre os<br />
anos lectivos <strong>de</strong> 2000/01 e 2004/05.<br />
• O Entroncamento apresentou, ao contrário <strong>do</strong>s<br />
restantes concelhos, um crescimento positivo na<br />
or<strong>de</strong>m <strong>do</strong>s 18,7%, claramente influencia<strong>do</strong> pelo<br />
forte crescimento populacional que o concelho<br />
tem manifesta<strong>do</strong> nos últimos anos.<br />
• A redução <strong>do</strong> número <strong>de</strong> alunos foi<br />
particularmente forte no Sar<strong>do</strong>al, Alcanena e<br />
Abrantes.<br />
• Face ao padrão nacional, a região apresenta<br />
um maior peso <strong>do</strong>s alunos inscritos no préescolar<br />
e no secundário, em <strong>de</strong>trimento <strong>do</strong>s<br />
restantes níveis <strong>de</strong> ensino.<br />
• Em Constância não existe ensino secundário,<br />
razão pela qual os restantes níveis <strong>de</strong> ensino<br />
atingem um maior peso relativo.<br />
210 – Parte IV <strong>Médio</strong> <strong>Tejo</strong> e <strong>Pinhal</strong> Interior Sul - Programa <strong>Territorial</strong> <strong>de</strong> <strong>Desenvolvimento</strong>