- Page 2:
Governo FederalSecretaria de Assunt
- Page 5:
NOTA DOS EDITORESCom este número 3
- Page 16 and 17:
14planejamento e políticas públic
- Page 18 and 19:
16planejamento e políticas públic
- Page 20 and 21:
18planejamento e políticas públic
- Page 23 and 24:
O Impacto do BNDES Exim no Tempo de
- Page 25 and 26:
O Impacto do BNDES Exim no Tempo de
- Page 27:
O Impacto do BNDES Exim no Tempo de
- Page 30 and 31:
28planejamento e políticas públic
- Page 32 and 33:
30planejamento e políticas públic
- Page 34 and 35:
32planejamento e políticas públic
- Page 36 and 37:
34planejamento e políticas públic
- Page 39 and 40:
METODOLOGIAS APLICADAS AO ESTUDO DA
- Page 41 and 42:
Metodologias Aplicadas ao Estudo da
- Page 43 and 44: Metodologias Aplicadas ao Estudo da
- Page 45 and 46: Metodologias Aplicadas ao Estudo da
- Page 47 and 48: Metodologias Aplicadas ao Estudo da
- Page 49 and 50: Metodologias Aplicadas ao Estudo da
- Page 51 and 52: Metodologias Aplicadas ao Estudo da
- Page 53 and 54: Metodologias Aplicadas ao Estudo da
- Page 55 and 56: Metodologias Aplicadas ao Estudo da
- Page 57 and 58: Metodologias Aplicadas ao Estudo da
- Page 59 and 60: Metodologias Aplicadas ao Estudo da
- Page 61 and 62: Metodologias Aplicadas ao Estudo da
- Page 63 and 64: Metodologias Aplicadas ao Estudo da
- Page 65 and 66: Metodologias Aplicadas ao Estudo da
- Page 67 and 68: Metodologias Aplicadas ao Estudo da
- Page 69: Metodologias Aplicadas ao Estudo da
- Page 72 and 73: 70planejamento e políticas públic
- Page 74 and 75: 72planejamento e políticas públic
- Page 76 and 77: 74planejamento e políticas públic
- Page 78 and 79: 76planejamento e políticas públic
- Page 80 and 81: 78planejamento e políticas públic
- Page 82 and 83: 80planejamento e políticas públic
- Page 84 and 85: 82planejamento e políticas públic
- Page 86 and 87: 84planejamento e políticas públic
- Page 88 and 89: 86planejamento e políticas públic
- Page 90 and 91: 88planejamento e políticas públic
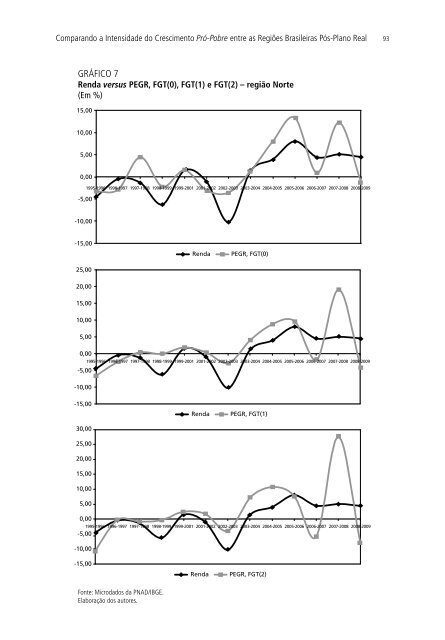
- Page 92 and 93: 90planejamento e políticas públic
- Page 96 and 97: 94planejamento e políticas públic
- Page 98 and 99: 96planejamento e políticas públic
- Page 100 and 101: 98planejamento e políticas públic
- Page 102 and 103: 100planejamento e políticas públi
- Page 104 and 105: 102planejamento e políticas públi
- Page 106 and 107: 104planejamento e políticas públi
- Page 109 and 110: CRISE DOS ALIMENTOS E ESTRATÉGIAS
- Page 111 and 112: Crise dos Alimentos e Estratégias
- Page 113 and 114: Crise dos Alimentos e Estratégias
- Page 115 and 116: Crise dos Alimentos e Estratégias
- Page 117 and 118: Crise dos Alimentos e Estratégias
- Page 119 and 120: Crise dos Alimentos e Estratégias
- Page 121 and 122: Crise dos Alimentos e Estratégias
- Page 123 and 124: Crise dos Alimentos e Estratégias
- Page 125 and 126: Crise dos Alimentos e Estratégias
- Page 127 and 128: Crise dos Alimentos e Estratégias
- Page 129 and 130: Crise dos Alimentos e Estratégias
- Page 131 and 132: Crise dos Alimentos e Estratégias
- Page 133 and 134: Crise dos Alimentos e Estratégias
- Page 135 and 136: UMA ANÁLISE DO ACESSO AO CRÉDITO
- Page 137 and 138: Uma Análise do Acesso ao Crédito
- Page 139 and 140: Uma Análise do Acesso ao Crédito
- Page 141 and 142: Uma Análise do Acesso ao Crédito
- Page 143 and 144: Uma Análise do Acesso ao Crédito
- Page 145 and 146:
Uma Análise do Acesso ao Crédito
- Page 147 and 148:
Uma Análise do Acesso ao Crédito
- Page 149 and 150:
Uma Análise do Acesso ao Crédito
- Page 151 and 152:
Uma Análise do Acesso ao Crédito
- Page 153 and 154:
Uma Análise do Acesso ao Crédito
- Page 155 and 156:
IMPACTOS DA PRODUÇÃO E DO ABATE E
- Page 157 and 158:
Impactos da Produção e do Abate e
- Page 159 and 160:
Impactos da Produção e do Abate e
- Page 161 and 162:
Impactos da Produção e do Abate e
- Page 163 and 164:
Impactos da Produção e do Abate e
- Page 165 and 166:
Impactos da Produção e do Abate e
- Page 167 and 168:
Impactos da Produção e do Abate e
- Page 169 and 170:
Impactos da Produção e do Abate e
- Page 171 and 172:
Impactos da Produção e do Abate e
- Page 173 and 174:
Impactos da Produção e do Abate e
- Page 175 and 176:
Impactos da Produção e do Abate e
- Page 177 and 178:
Impactos da Produção e do Abate e
- Page 179 and 180:
Impactos da Produção e do Abate e
- Page 181 and 182:
Impactos da Produção e do Abate e
- Page 183 and 184:
Impactos da Produção e do Abate e
- Page 185 and 186:
REDEFININDO PAPÉIS NO PROCESSO DE
- Page 187 and 188:
Redefinindo Papéis no Processo de
- Page 189 and 190:
Redefinindo Papéis no Processo de
- Page 191 and 192:
Redefinindo Papéis no Processo de
- Page 193 and 194:
Redefinindo Papéis no Processo de
- Page 195 and 196:
Redefinindo Papéis no Processo de
- Page 197 and 198:
Redefinindo Papéis no Processo de
- Page 199 and 200:
Redefinindo Papéis no Processo de
- Page 201 and 202:
Redefinindo Papéis no Processo de
- Page 203 and 204:
Redefinindo Papéis no Processo de
- Page 205 and 206:
Redefinindo Papéis no Processo de
- Page 207 and 208:
Redefinindo Papéis no Processo de
- Page 209 and 210:
Redefinindo Papéis no Processo de
- Page 211 and 212:
Redefinindo Papéis no Processo de
- Page 213 and 214:
CONSIDERAÇÕES SOBRE A DINÂMICA D
- Page 215 and 216:
Considerações sobre a Dinâmica d
- Page 217 and 218:
Considerações sobre a Dinâmica d
- Page 219 and 220:
Considerações sobre a Dinâmica d
- Page 221 and 222:
Considerações sobre a Dinâmica d
- Page 223 and 224:
Considerações sobre a Dinâmica d
- Page 225 and 226:
Considerações sobre a Dinâmica d
- Page 227 and 228:
Considerações sobre a Dinâmica d
- Page 229 and 230:
Considerações sobre a Dinâmica d
- Page 231 and 232:
Considerações sobre a Dinâmica d
- Page 233 and 234:
Considerações sobre a Dinâmica d
- Page 235 and 236:
Considerações sobre a Dinâmica d
- Page 237:
Considerações sobre a Dinâmica d
- Page 240 and 241:
238planejamento e políticas públi
- Page 242 and 243:
240planejamento e políticas públi
- Page 244 and 245:
242planejamento e políticas públi
- Page 246 and 247:
244planejamento e políticas públi
- Page 248 and 249:
246planejamento e políticas públi
- Page 250 and 251:
248planejamento e políticas públi
- Page 252 and 253:
250planejamento e políticas públi
- Page 254 and 255:
252planejamento e políticas públi
- Page 256 and 257:
254planejamento e políticas públi
- Page 258 and 259:
256planejamento e políticas públi
- Page 260 and 261:
258planejamento e políticas públi
- Page 262 and 263:
260planejamento e políticas públi
- Page 264:
262planejamento e políticas públi
- Page 267 and 268:
NORMAS AOS COLABORADORES DE PLANEJA