- Page 1 and 2:
BUILDING DESIGN AND CONSTRUCTION HA
- Page 3 and 4:
CONTRIBUTORS David J. Akers Civil E
- Page 5 and 6:
ABOUT THE EDITORS Frederick S. Merr
- Page 7 and 8:
Contributors xxi Preface xxiii CONT
- Page 9 and 10:
GYPSUM PRODUCTS 4.26 Gypsumboard /
- Page 11 and 12:
CONTENTS ix Section 6 Soil Mechanic
- Page 13 and 14:
CONTENTS xi 8.22 Cellular Steel Flo
- Page 15 and 16:
CONTENTS xiii 9.80 Pile Foundations
- Page 17 and 18:
CONTENTS xv CERAMIC-TILE CONSTRUCTI
- Page 19 and 20:
13.14 Unit Heaters / 13.56 13.15 Ra
- Page 21 and 22:
CONTENTS xix Section 17 Constructio
- Page 23 and 24:
1.2 SECTION ONE Building design is
- Page 25 and 26:
1.4 SECTION ONE and performance of
- Page 27 and 28:
1.6 SECTION ONE building designers,
- Page 29 and 30:
1.8 SECTION ONE 1.5 ROLE OF THE CLI
- Page 31 and 32:
1.10 SECTION ONE other component is
- Page 33 and 34:
1.12 SECTION ONE FIGURE 1.3 Structu
- Page 35 and 36:
1.14 SECTION ONE 1.4g). Figure 1.4h
- Page 37 and 38:
1.16 SECTION ONE (a) FIGURE 1.6 Exa
- Page 39 and 40:
1.18 SECTION ONE transmit to suppor
- Page 41 and 42:
1.20 SECTION ONE Daylight is the so
- Page 43 and 44:
1.22 SECTION ONE vators may be prog
- Page 45 and 46:
1.24 SECTION ONE system may be more
- Page 47 and 48:
1.26 SECTION ONE after a specific n
- Page 49 and 50:
1.28 SECTION ONE all the necessary
- Page 51 and 52:
1.30 SECTION ONE 4. Employ techniqu
- Page 53 and 54:
1.32 SECTION ONE In listing objecti
- Page 55 and 56:
1.34 SECTION ONE Variables represen
- Page 57 and 58:
1.36 SECTION ONE Design of the foot
- Page 59 and 60:
1.38 SECTION ONE with noncombustibl
- Page 61 and 62:
1.40 SECTION ONE permits the buildi
- Page 63 and 64:
1.42 SECTION ONE Systems design sho
- Page 65 and 66:
2.2 SECTION TWO 2.1 PROFESSIONAL AN
- Page 67 and 68:
2.4 SECTION TWO quality systems, mo
- Page 69 and 70:
2.6 SECTION TWO neering firm. The p
- Page 71 and 72:
2.8 SECTION TWO For projects where
- Page 73 and 74:
2.10 SECTION TWO permits clients to
- Page 75 and 76:
2.12 SECTION TWO 2.9 ACCELERATED DE
- Page 77 and 78:
2.14 SECTION TWO the architect’s
- Page 79 and 80:
2.16 SECTION TWO centers, and indoo
- Page 81 and 82:
2.18 SECTION TWO 2.16 COST ESTIMATI
- Page 83 and 84:
2.20 SECTION TWO 9. Finishes 10. Sp
- Page 85 and 86:
2.22 SECTION TWO stitute format (Ar
- Page 87 and 88:
2.24 SECTION TWO 2.20 BIDDING AND C
- Page 89 and 90:
2.26 SECTION TWO 2.23 ROLE OF ARCHI
- Page 91 and 92:
2.28 SECTION TWO proposed by the co
- Page 93 and 94:
2.30 SECTION TWO client, building e
- Page 95 and 96:
2.32 SECTION TWO place. It is the p
- Page 97 and 98:
3.2 SECTION THREE tall and narrow,
- Page 99 and 100:
3.4 SECTION THREE it is known for a
- Page 101 and 102:
3.6 SECTION THREE ing damage by win
- Page 103 and 104:
3.8 SECTION THREE large that the st
- Page 105 and 106:
3.10 SECTION THREE forces. Generall
- Page 107 and 108:
3.12 SECTION THREE directions, both
- Page 109 and 110:
3.14 SECTION THREE mic loads, on th
- Page 111 and 112:
3.16 SECTION THREE be protected wit
- Page 113 and 114:
3.18 SECTION THREE The primary drai
- Page 115 and 116:
3.20 SECTION THREE should preferabl
- Page 117 and 118:
3.22 SECTION THREE where the walls
- Page 119 and 120:
3.24 SECTION THREE If the concrete
- Page 121 and 122:
3.26 SECTION THREE Factory-made por
- Page 123 and 124:
3.28 SECTION THREE and aqueous disp
- Page 125 and 126:
3.30 SECTION THREE community. In th
- Page 127 and 128:
3.32 SECTION THREE FIGURE 3.9 Time-
- Page 129 and 130:
3.34 SECTION THREE (‘‘Life Safe
- Page 131 and 132:
3.36 SECTION THREE For Class C fire
- Page 133 and 134:
3.38 SECTION THREE Hazard to person
- Page 135 and 136:
3.40 SECTION THREE Photoelectric De
- Page 137 and 138:
3.42 SECTION THREE High-Rise Buildi
- Page 139 and 140:
3.44 SECTION THREE Interior stairs
- Page 141 and 142:
3.46 SECTION THREE TABLE 3.6 Typica
- Page 143 and 144:
3.48 SECTION THREE necessary superv
- Page 145 and 146:
3.50 SECTION THREE The key element
- Page 147 and 148:
3.52 SECTION THREE 1. Detect a brea
- Page 149 and 150:
4.2 SECTION FOUR Limes, wherein the
- Page 151 and 152:
4.4 SECTION FOUR TABLE 4.1 Chemical
- Page 153 and 154:
4.6 SECTION FOUR TABLE 4.3 Relative
- Page 155 and 156:
4.8 SECTION FOUR Plasticity of mort
- Page 157 and 158:
4.10 SECTION FOUR Fly ashes are pro
- Page 159 and 160:
4.12 SECTION FOUR National Stone As
- Page 161 and 162:
4.14 SECTION FOUR 4.11.9 Volume Sta
- Page 163 and 164:
4.16 SECTION FOUR with less cement
- Page 165 and 166:
4.18 SECTION FOUR of color requires
- Page 167 and 168:
4.20 SECTION FOUR sometimes encount
- Page 169 and 170:
4.22 SECTION FOUR 4.17.1 Normal-Wei
- Page 171 and 172:
4.24 SECTION FOUR weights range fro
- Page 173 and 174:
4.26 SECTION FOUR TABLE 4.6 High-Pe
- Page 175 and 176:
4.28 SECTION FOUR of 4 � 8 � 16
- Page 177 and 178:
4.30 SECTION FOUR TABLE 4.8 Physica
- Page 179 and 180:
4.32 SECTION FOUR 4.22 CERAMIC TILE
- Page 181 and 182:
4.34 SECTION FOUR No. 305, Vol. 20,
- Page 183 and 184:
4.36 SECTION FOUR Gypsum Wallboard.
- Page 185 and 186:
4.38 SECTION FOUR two thicknesses
- Page 187 and 188:
4.40 SECTION FOUR Transparent Mirro
- Page 189 and 190:
TABLE 4.14 Strength of Some Commerc
- Page 191 and 192:
4.44 SECTION FOUR as longitudinal,
- Page 193 and 194:
4.46 SECTION FOUR it is usually at
- Page 195 and 196:
4.48 SECTION FOUR ified or of given
- Page 197 and 198:
4.50 SECTION FOUR pumped in under p
- Page 199 and 200:
4.52 SECTION FOUR both faces, excep
- Page 201 and 202:
TABLE 4.16 ASTM Requirements for St
- Page 203 and 204:
4.56 SECTION FOUR Above 2.0% carbon
- Page 205 and 206:
4.58 SECTION FOUR High-strength, lo
- Page 207 and 208:
4.60 SECTION FOUR element is strain
- Page 209 and 210:
4.62 SECTION FOUR is usually heated
- Page 211 and 212:
TABLE 4.19 Effects of Alloying Elem
- Page 213 and 214:
TABLE 4.19 Effects of Alloying Elem
- Page 215 and 216:
4.68 SECTION FOUR strength of 75 ks
- Page 217 and 218:
4.70 SECTION FOUR for preventing di
- Page 219 and 220:
4.72 SECTION FOUR Semikilled steel
- Page 221 and 222:
4.74 SECTION FOUR 4.49 CORROSION OF
- Page 223 and 224:
4.76 SECTION FOUR alloys to indicat
- Page 225 and 226:
4.78 SECTION FOUR TABLE 4.22 Finish
- Page 227 and 228:
4.80 SECTION FOUR other metals, the
- Page 229 and 230:
4.82 SECTION FOUR trical sockets, d
- Page 231 and 232:
4.84 SECTION FOUR with good corrosi
- Page 233 and 234:
4.86 SECTION FOUR in resisting oxid
- Page 235 and 236:
4.88 SECTION FOUR into desired shap
- Page 237 and 238:
4.90 SECTION FOUR other thermosetti
- Page 239 and 240:
4.92 SECTION FOUR Nylon. Molded nyl
- Page 241 and 242:
4.94 SECTION FOUR These materials m
- Page 243 and 244:
4.96 SECTION FOUR indoor and outdoo
- Page 245 and 246:
4.98 SECTION FOUR 4.81.1 Built-Up R
- Page 247 and 248:
4.100 SECTION FOUR other because of
- Page 249 and 250:
4.102 SECTION FOUR PAINTS AND OTHER
- Page 251 and 252:
4.104 SECTION FOUR Titanium dioxide
- Page 253 and 254:
SECTION FIVE STRUCTURAL THEORY Akba
- Page 255 and 256:
STRUCTURAL THEORY 5.3 Torsional loa
- Page 257 and 258:
TABLE 5.1 Minimum Design Dead Loads
- Page 259 and 260:
TABLE 5.2 Minimum Design Live Loads
- Page 261 and 262:
STRUCTURAL THEORY 5.9 L � 20R R
- Page 263 and 264:
STRUCTURAL THEORY 5.11 Wind pressur
- Page 265 and 266:
STRUCTURAL THEORY 5.13 In ASCE-7-95
- Page 267 and 268:
STRUCTURAL THEORY 5.15 loaded with
- Page 269 and 270:
STRUCTURAL THEORY 5.17 Building cod
- Page 271 and 272:
STRUCTURAL THEORY 5.19 Suppose, for
- Page 273 and 274:
STRUCTURAL THEORY 5.21 Since for th
- Page 275 and 276:
STRUCTURAL THEORY 5.23 Since AL is
- Page 277 and 278:
FIGURE 5.7 Normal and shear stresse
- Page 279 and 280:
FIGURE 5.9 Mohr’s circle for stre
- Page 281 and 282:
STRUCTURAL THEORY 5.29 Circular Sec
- Page 283 and 284:
STRUCTURAL THEORY 5.31 FIGURE 5.11
- Page 285 and 286:
STRUCTURAL THEORY 5.33 FIGURE 5.18
- Page 287 and 288:
STRUCTURAL THEORY 5.35 The bending
- Page 289 and 290:
STRUCTURAL THEORY 5.37 FIGURE 5.22
- Page 291 and 292:
FIGURE 5.25 Unit stresses on a beam
- Page 293 and 294:
STRUCTURAL THEORY 5.41 of Mohr’s
- Page 295 and 296:
STRUCTURAL THEORY 5.43 The tangenti
- Page 297 and 298:
STRUCTURAL THEORY 5.45 FIGURE 5.29
- Page 299 and 300:
FIGURE 5.32 Concentrated load at an
- Page 301 and 302:
STRUCTURAL THEORY 5.49 FIGURE 5.35
- Page 303 and 304:
STRUCTURAL THEORY 5.51 FIGURE 5.38
- Page 305 and 306:
STRUCTURAL THEORY 5.53 FIGURE 5.41
- Page 307 and 308:
STRUCTURAL THEORY 5.55 I�R yo �
- Page 309 and 310:
STRUCTURAL THEORY 5.57 where ƒr
- Page 311 and 312:
STRUCTURAL THEORY 5.59 This assumes
- Page 313 and 314:
STRUCTURAL THEORY 5.61 column curve
- Page 315 and 316:
STRUCTURAL THEORY 5.63 force beginn
- Page 317 and 318:
STRUCTURAL THEORY 5.65 FIGURE 5.47
- Page 319 and 320:
STRUCTURAL THEORY 5.67 On the other
- Page 321 and 322:
FIGURE 5.50 Statically indeterminat
- Page 323 and 324:
FIGURE 5.51 Dummy unit-load method
- Page 325 and 326:
STRUCTURAL THEORY 5.73 FIGURE 5.53
- Page 327 and 328:
STRUCTURAL THEORY 5.75 principle st
- Page 329 and 330:
STRUCTURAL THEORY 5.77 AX � B, wh
- Page 331 and 332:
STRUCTURAL THEORY 5.79 FIGURE 5.59
- Page 333 and 334:
STRUCTURAL THEORY 5.81 L �L �
- Page 335 and 336:
STRUCTURAL THEORY 5.83 3EI K � (5
- Page 337 and 338:
FIGURE 5.66 Moments for concentrate
- Page 339 and 340:
STRUCTURAL THEORY 5.87 FIGURE 5.71
- Page 341 and 342:
STRUCTURAL THEORY 5.89 � � 4EI
- Page 343 and 344:
STRUCTURAL THEORY 5.91 end moments
- Page 345 and 346:
STRUCTURAL THEORY 5.93 At A, for wh
- Page 347 and 348:
STRUCTURAL THEORY 5.95 the columns
- Page 349 and 350:
STRUCTURAL THEORY 5.97 5.11.10 Rapi
- Page 351 and 352:
STRUCTURAL THEORY 5.99 Similarly, a
- Page 353 and 354:
STRUCTURAL THEORY 5.101 ported beam
- Page 355 and 356:
STRUCTURAL THEORY 5.103 FIGURE 5.83
- Page 357 and 358:
STRUCTURAL THEORY 5.105 Wall A: 6.6
- Page 359 and 360:
STRUCTURAL THEORY 5.107 designed wi
- Page 361 and 362:
STRUCTURAL THEORY 5.109 1 � �
- Page 363 and 364:
STRUCTURAL THEORY 5.111 a thin plat
- Page 365 and 366:
STRUCTURAL THEORY 5.113 independent
- Page 367 and 368:
STRUCTURAL THEORY 5.115 k1 0 ... 0
- Page 369 and 370:
5.14.2 Two-Hinged Arches FIGURE 5.9
- Page 371 and 372:
STRUCTURAL THEORY 5.119 forces acti
- Page 373 and 374:
STRUCTURAL THEORY 5.121 FIGURE 5.97
- Page 375 and 376:
STRUCTURAL THEORY 5.123 � � 2 V
- Page 377 and 378:
STRUCTURAL THEORY 5.125 FIGURE 5.99
- Page 379 and 380:
STRUCTURAL THEORY 5.127 E 166.7h m
- Page 381 and 382:
STRUCTURAL THEORY 5.129 roof girder
- Page 383 and 384:
STRUCTURAL THEORY 5.131 H q o �1
- Page 385 and 386:
STRUCTURAL THEORY 5.133 wl o TL �
- Page 387 and 388:
5.16.2 Cable Systems STRUCTURAL THE
- Page 389 and 390:
STRUCTURAL THEORY 5.137 natural fre
- Page 391 and 392:
STRUCTURAL THEORY 5.139 FIGURE 5.10
- Page 393 and 394:
STRUCTURAL THEORY 5.141 methods tha
- Page 395 and 396:
STRUCTURAL THEORY 5.143 load that p
- Page 397 and 398:
� W 1 2 STRUCTURAL THEORY 5.145 k
- Page 399 and 400:
STRUCTURAL THEORY 5.147 mass has an
- Page 401 and 402:
STRUCTURAL THEORY 5.149 An approxim
- Page 403 and 404:
For smaller values of �, it is gi
- Page 405 and 406:
STRUCTURAL THEORY 5.153 k � sprin
- Page 407 and 408:
STRUCTURAL THEORY 5.155 FIGURE 5.11
- Page 409 and 410:
STRUCTURAL THEORY 5.157 New York; N
- Page 411 and 412:
STRUCTURAL THEORY 5.159 Eq. (5.289)
- Page 413 and 414:
STRUCTURAL THEORY 5.161 equivalent
- Page 415 and 416:
STRUCTURAL THEORY 5.163 R in Table
- Page 417 and 418:
TABLE 5.9 Design Coefficients and F
- Page 419 and 420:
TABLE 5.9 Design Coefficients and F
- Page 421 and 422:
STRUCTURAL THEORY 5.169 TABLE 5.10
- Page 423 and 424:
TABLE 5.13 Vertical Structural Irre
- Page 425 and 426:
STRUCTURAL THEORY 5.173 TABLE 5.15
- Page 427 and 428:
STRUCTURAL THEORY 5.175 • S a sha
- Page 429 and 430:
STRUCTURAL THEORY 5.177 where C T
- Page 431 and 432:
STRUCTURAL THEORY 5.179 • 1.0 for
- Page 433 and 434:
where r � max STRUCTURAL THEORY 5
- Page 435 and 436:
STRUCTURAL THEORY 5.183 0.3S DSI pW
- Page 437 and 438:
STRUCTURAL THEORY 5.185 TABLE 5.20
- Page 439 and 440:
STRUCTURAL THEORY 5.187 FIGURE 5.11
- Page 441 and 442:
SECTION SIX SOIL MECHANICS AND FOUN
- Page 443 and 444:
SOIL MECHANICS AND FOUNDATIONS 6.3
- Page 445 and 446:
TABLE 6.2 Common Types of Foundatio
- Page 447 and 448:
TABLE 6.3 Boring, Core Drilling, Sa
- Page 449 and 450:
TABLE 6.3 Boring, Core Drilling, Sa
- Page 451 and 452:
TABLE 6.3 Boring, Core Drilling, Sa
- Page 453 and 454:
SOIL MECHANICS AND FOUNDATIONS 6.13
- Page 455 and 456:
SOIL MECHANICS AND FOUNDATIONS 6.15
- Page 457 and 458:
SOIL MECHANICS AND FOUNDATIONS 6.17
- Page 459 and 460:
SOIL MECHANICS AND FOUNDATIONS 6.19
- Page 461 and 462:
SOIL MECHANICS AND FOUNDATIONS 6.21
- Page 463 and 464:
SOIL MECHANICS AND FOUNDATIONS 6.23
- Page 465 and 466:
SOIL MECHANICS AND FOUNDATIONS 6.25
- Page 467 and 468:
SOIL MECHANICS AND FOUNDATIONS 6.27
- Page 469 and 470:
TABLE 6.7 Mass and Volume Relations
- Page 471 and 472:
TABLE 6.8 Unified Soil Classificati
- Page 473 and 474:
FIGURE 6.9 Plasticity chart. SOIL M
- Page 475 and 476:
Notes: 1. Classification Procedure:
- Page 477 and 478:
6.37 TABLE 6.10 Soil Classification
- Page 479 and 480:
SOIL MECHANICS AND FOUNDATIONS 6.39
- Page 481 and 482:
SOIL MECHANICS AND FOUNDATIONS 6.41
- Page 483 and 484:
SOIL MECHANICS AND FOUNDATIONS 6.43
- Page 485 and 486:
SOIL MECHANICS AND FOUNDATIONS 6.45
- Page 487 and 488:
SOIL MECHANICS AND FOUNDATIONS 6.47
- Page 489 and 490:
SOIL MECHANICS AND FOUNDATIONS 6.49
- Page 491 and 492:
SOIL MECHANICS AND FOUNDATIONS 6.51
- Page 493 and 494:
SOIL MECHANICS AND FOUNDATIONS 6.53
- Page 495 and 496:
SOIL MECHANICS AND FOUNDATIONS 6.55
- Page 497 and 498:
SOIL MECHANICS AND FOUNDATIONS 6.57
- Page 499 and 500:
SOIL MECHANICS AND FOUNDATIONS 6.59
- Page 501 and 502:
SOIL MECHANICS AND FOUNDATIONS 6.61
- Page 503 and 504:
SOIL MECHANICS AND FOUNDATIONS 6.63
- Page 505 and 506:
SOIL MECHANICS AND FOUNDATIONS 6.65
- Page 507 and 508:
SOIL MECHANICS AND FOUNDATIONS 6.67
- Page 509 and 510:
SOIL MECHANICS AND FOUNDATIONS 6.69
- Page 511 and 512:
SOIL MECHANICS AND FOUNDATIONS 6.71
- Page 513 and 514:
SOIL MECHANICS AND FOUNDATIONS 6.73
- Page 515 and 516:
SOIL MECHANICS AND FOUNDATIONS 6.75
- Page 517 and 518:
SOIL MECHANICS AND FOUNDATIONS 6.77
- Page 519 and 520:
SOIL MECHANICS AND FOUNDATIONS 6.79
- Page 521 and 522:
SOIL MECHANICS AND FOUNDATIONS 6.81
- Page 523 and 524:
SOIL MECHANICS AND FOUNDATIONS 6.83
- Page 525 and 526:
SOIL MECHANICS AND FOUNDATIONS 6.85
- Page 527 and 528:
SOIL MECHANICS AND FOUNDATIONS 6.87
- Page 529 and 530:
SOIL MECHANICS AND FOUNDATIONS 6.89
- Page 531 and 532:
SOIL MECHANICS AND FOUNDATIONS 6.91
- Page 533 and 534:
TABLE 6.15 Typical Pile Characteris
- Page 535 and 536:
TABLE 6.15 Typical Pile Characteris
- Page 537 and 538:
SOIL MECHANICS AND FOUNDATIONS 6.97
- Page 539 and 540:
SOIL MECHANICS AND FOUNDATIONS 6.99
- Page 541 and 542:
SOIL MECHANICS AND FOUNDATIONS 6.10
- Page 543 and 544:
SOIL MECHANICS AND FOUNDATIONS 6.10
- Page 545 and 546:
SOIL MECHANICS AND FOUNDATIONS 6.10
- Page 547 and 548:
TABLE 6.20 Characterics of Compacte
- Page 549 and 550:
SOIL MECHANICS AND FOUNDATIONS 6.10
- Page 551 and 552:
TABLE 6.21 Site Improvement Methods
- Page 553 and 554:
TABLE 6.21 Site Improvement Methods
- Page 555 and 556:
6.11 GEOSYNTHETICS SOIL MECHANICS A
- Page 557 and 558:
SOIL MECHANICS AND FOUNDATIONS 6.11
- Page 559 and 560:
SOIL MECHANICS AND FOUNDATIONS 6.11
- Page 561 and 562:
SOIL MECHANICS AND FOUNDATIONS 6.12
- Page 563 and 564:
7.2 SECTION SEVEN by the fabricator
- Page 565 and 566:
7.4 SECTION SEVEN 7.2.1 Grades of S
- Page 567 and 568:
7.6 SECTION SEVEN recommended stand
- Page 569 and 570:
7.8 SECTION SEVEN 7.3 FASTENERS Two
- Page 571 and 572:
7.10 SECTION SEVEN TABLE 7.5 Washer
- Page 573 and 574:
7.12 SECTION SEVEN riveting gun, en
- Page 575 and 576:
7.14 SECTION SEVEN TABLE 7.7 Minimu
- Page 577 and 578:
7.16 SECTION SEVEN FIGURE 7.5 Symbo
- Page 579 and 580:
7.18 SECTION SEVEN owner, design pr
- Page 581 and 582:
7.20 SECTION SEVEN FIGURE 7.7 Wall-
- Page 583 and 584:
7.22 SECTION SEVEN than all forms o
- Page 585 and 586:
7.24 SECTION SEVEN FIGURE 7.11 Type
- Page 587 and 588:
7.26 SECTION SEVEN to carry little
- Page 589 and 590:
7.28 SECTION SEVEN FIGURE 7.14 Stee
- Page 591 and 592:
7.30 SECTION SEVEN Composite constr
- Page 593 and 594:
7.32 SECTION SEVEN Moment-Resisting
- Page 595 and 596:
7.34 SECTION SEVEN walls; neverthel
- Page 597 and 598:
7.36 SECTION SEVEN ities, size, spa
- Page 599 and 600:
7.38 SECTION SEVEN answer requires
- Page 601 and 602:
7.40 SECTION SEVEN Resistance to la
- Page 603 and 604:
7.42 SECTION SEVEN Temporary covera
- Page 605 and 606:
7.44 SECTION SEVEN filler blocks—
- Page 607 and 608:
7.46 SECTION SEVEN TABLE 7.9 Handbo
- Page 609 and 610:
7.48 SECTION SEVEN ing stress ƒ b
- Page 611 and 612:
7.50 SECTION SEVEN TABLE 7.11 Tensi
- Page 613 and 614:
7.52 SECTION SEVEN Constructions th
- Page 615 and 616:
FIGURE 7.29 Maximum width-thickness
- Page 617 and 618:
7.56 SECTION SEVEN unimportance of
- Page 619 and 620:
7.58 SECTION SEVEN FIGURE 7.30 Requ
- Page 621 and 622:
7.60 SECTION SEVEN Compactness Requ
- Page 623 and 624:
7.62 SECTION SEVEN TABLE 7.14 Allow
- Page 625 and 626:
7.64 SECTION SEVEN TABLE 7.16 Limit
- Page 627 and 628:
7.66 SECTION SEVEN 2 Mcr � C b (
- Page 629 and 630:
7.68 SECTION SEVEN FIGURE 7.33 Plat
- Page 631 and 632:
7.70 SECTION SEVEN are welded perpe
- Page 633 and 634:
7.72 SECTION SEVEN 2 1 � Cva (a/h
- Page 635 and 636:
7.74 SECTION SEVEN of lateral-torsi
- Page 637 and 638:
7.76 SECTION SEVEN 7.22 WEB OR FLAN
- Page 639 and 640:
7.78 SECTION SEVEN 3 4100 t �Fyc
- Page 641 and 642:
7.80 SECTION SEVEN For expansion ro
- Page 643 and 644:
7.82 SECTION SEVEN where M nt � r
- Page 645 and 646:
7.84 SECTION SEVEN Connector Detail
- Page 647 and 648:
7.86 SECTION SEVEN prevent overstre
- Page 649 and 650:
7.88 SECTION SEVEN H � length of
- Page 651 and 652:
7.90 SECTION SEVEN FIGURE 7.39 Stee
- Page 653 and 654:
7.92 SECTION SEVEN 7.30.1 ASD for B
- Page 655 and 656:
7.94 SECTION SEVEN TABLE 7.26 Desig
- Page 657 and 658:
7.96 SECTION SEVEN be subject to fa
- Page 659 and 660:
7.98 SECTION SEVEN FIGURE 7.41 Ecce
- Page 661 and 662:
7.100 SECTION SEVEN axis equals the
- Page 663 and 664:
7.102 SECTION SEVEN FIGURE 7.44 Typ
- Page 665 and 666:
7.104 SECTION SEVEN not a factor. S
- Page 667 and 668:
7.106 SECTION SEVEN FIGURE 7.48 Wel
- Page 669 and 670:
7.108 SECTION SEVEN FIGURE 7.50 End
- Page 671 and 672:
7.110 SECTION SEVEN and usually ind
- Page 673 and 674:
7.112 SECTION SEVEN or welded const
- Page 675 and 676:
7.114 SECTION SEVEN FIGURE 7.55 Wel
- Page 677 and 678:
7.116 SECTION SEVEN FIGURE 7.57 Wel
- Page 679 and 680:
7.118 SECTION SEVEN FIGURE 7.58 Ere
- Page 681 and 682:
7.120 SECTION SEVEN There is an est
- Page 683 and 684:
7.122 SECTION SEVEN FIGURE 7.62 Per
- Page 685 and 686:
7.124 SECTION SEVEN The whole opera
- Page 687 and 688:
7.126 SECTION SEVEN common service
- Page 689 and 690:
7.128 SECTION SEVEN 1. Steel that i
- Page 691 and 692:
7.130 SECTION SEVEN that the steel
- Page 693 and 694:
7.132 SECTION SEVEN FIGURE 7.65 Fir
- Page 695 and 696:
7.134 SECTION SEVEN American Instit
- Page 697 and 698:
8.2 SECTION EIGHT Cold-formed shape
- Page 699 and 700:
TABLE 8-2 Principal Mechanical Prop
- Page 701 and 702:
TABLE 8-2 Principal Mechanical Prop
- Page 703 and 704:
8.8 SECTION EIGHT TABLE 8.3 Gages,
- Page 705 and 706:
8.10 SECTION EIGHT FIGURE 8.2 Misce
- Page 707 and 708:
TABLE 8.4 Properties of Area and Li
- Page 709 and 710:
8.14 SECTION EIGHT The Committee on
- Page 711 and 712:
8.16 SECTION EIGHT In 1932, von Kar
- Page 713 and 714:
8.18 FIGURE 8.6 Schematic diagrams
- Page 715 and 716:
8.20 SECTION EIGHT Webs Subjected t
- Page 717 and 718:
8.22 SECTION EIGHT 8.9 MAXIMUM FLAT
- Page 719 and 720:
8.24 SECTION EIGHT where P n � ul
- Page 721 and 722:
8.26 SECTION EIGHT weld quality. Me
- Page 723 and 724:
8.28 SECTION EIGHT other sheets of
- Page 725 and 726:
8.30 SECTION EIGHT may be used to c
- Page 727 and 728:
8.32 SECTION EIGHT TABLE 8.5 Design
- Page 729 and 730:
8.34 SECTION EIGHT TABLE 8.7 ASTM B
- Page 731 and 732:
8.36 SECTION EIGHT TABLE 8.9 Nomina
- Page 733 and 734:
8.38 SECTION EIGHT TABLE 8.11 Nomin
- Page 735 and 736:
8.40 SECTION EIGHT 8.19 SELF-TAPPIN
- Page 737 and 738:
8.42 SECTION EIGHT FIGURE 8.13 Roof
- Page 739 and 740:
8.44 TABLE 8.13 Allowable Total (De
- Page 741 and 742:
8.46 SECTION EIGHT Maximum Deflecti
- Page 743 and 744:
8.48 SECTION EIGHT TABLE 8.14 Fire
- Page 745 and 746:
8.50 SECTION EIGHT service outlets
- Page 747 and 748:
8.52 SECTION EIGHT K � pitch-dept
- Page 749 and 750:
8.54 SECTION EIGHT TABLE 8.15 Physi
- Page 751 and 752:
8.56 SECTION EIGHT Many preengineer
- Page 753 and 754:
8.58 SECTION EIGHT Construction (AI
- Page 755 and 756:
SECTION NINE CONCRETE CONSTRUCTION
- Page 757 and 758:
CONCRETE CONSTRUCTION 9.3 FIGURE 9.
- Page 759 and 760:
CONCRETE CONSTRUCTION 9.5 the owner
- Page 761 and 762:
CONCRETE CONSTRUCTION 9.7 proportio
- Page 763 and 764:
CONCRETE CONSTRUCTION 9.9 In additi
- Page 765 and 766:
CONCRETE CONSTRUCTION 9.11 entraini
- Page 767 and 768:
CONCRETE CONSTRUCTION 9.13 greatly
- Page 769 and 770:
CONCRETE CONSTRUCTION 9.15 TABLE 9.
- Page 771 and 772:
CONCRETE CONSTRUCTION 9.17 Other AC
- Page 773 and 774:
CONCRETE CONSTRUCTION 9.19 Conventi
- Page 775 and 776:
CONCRETE CONSTRUCTION 9.21 For exam
- Page 777 and 778:
CONCRETE CONSTRUCTION 9.23 formwork
- Page 779 and 780:
CONCRETE CONSTRUCTION 9.25 dropped
- Page 781 and 782:
TABLE 9.4 ASTM Standard Rebars Bar
- Page 783 and 784:
TABLE 9.6 Standard Wire Sizes for R
- Page 785 and 786:
TABLE 9.7 Standard Hooks* (Continue
- Page 787 and 788:
CONCRETE CONSTRUCTION 9.33 as well
- Page 789 and 790:
CONCRETE CONSTRUCTION 9.35 ditions
- Page 791 and 792:
CONCRETE CONSTRUCTION 9.37 For conc
- Page 793 and 794:
CONCRETE CONSTRUCTION 9.39 In pract
- Page 795 and 796:
CONCRETE CONSTRUCTION 9.41 The engi
- Page 797 and 798:
CONCRETE CONSTRUCTION 9.43 FIGURE 9
- Page 799 and 800:
9.43 SPECIAL ANALYSES CONCRETE CONS
- Page 801 and 802:
9.44.2 Load Factors CONCRETE CONSTR
- Page 803 and 804:
CONCRETE CONSTRUCTION 9.49 section;
- Page 805 and 806:
CONCRETE CONSTRUCTION 9.51 that A s
- Page 807 and 808:
CONCRETE CONSTRUCTION 9.53 FIGURE 9
- Page 809 and 810:
9.48 TORSION IN REINFORCED CONCRETE
- Page 811 and 812:
CONCRETE CONSTRUCTION 9.57 Where to
- Page 813 and 814:
CONCRETE CONSTRUCTION 9.59 9.49.2 D
- Page 815 and 816:
where � � 0.8 for bar sizes #3-
- Page 817 and 818:
CONCRETE CONSTRUCTION 9.63 TABLE 9.
- Page 819 and 820:
CONCRETE CONSTRUCTION 9.65 exceeds
- Page 821 and 822:
CONCRETE CONSTRUCTION 9.67 FIGURE 9
- Page 823 and 824:
CONCRETE CONSTRUCTION 9.69 length r
- Page 825 and 826:
CONCRETE CONSTRUCTION 9.71 yield st
- Page 827 and 828:
CONCRETE CONSTRUCTION 9.73 where Mc
- Page 829 and 830:
ONE-WAY REINFORCED-CONCRETE SLABS C
- Page 831 and 832:
9.53 EMBEDDED PIPES IN ONE-WAY SLAB
- Page 833 and 834:
CONCRETE CONSTRUCTION 9.79 One-way
- Page 835 and 836:
CONCRETE CONSTRUCTION 9.81 Minimum
- Page 837 and 838:
CONCRETE CONSTRUCTION 9.83 FIGURE 9
- Page 839 and 840:
CONCRETE CONSTRUCTION 9.85 Step 2.
- Page 841 and 842:
CONCRETE CONSTRUCTION 9.87 where
- Page 843 and 844:
CONCRETE CONSTRUCTION 9.89 FIGURE 9
- Page 845 and 846:
TABLE 9.21 Commonly Used Sizes of T
- Page 847 and 848:
CONCRETE CONSTRUCTION 9.93 and the
- Page 849 and 850:
CONCRETE CONSTRUCTION 9.95 FIGURE 9
- Page 851 and 852:
CONCRETE CONSTRUCTION 9.97 Need for
- Page 853 and 854:
CONCRETE CONSTRUCTION 9.99 tored sh
- Page 855 and 856:
CONCRETE CONSTRUCTION 9.101 TABLE 9
- Page 857 and 858:
CONCRETE CONSTRUCTION 9.103 If slen
- Page 859 and 860:
CONCRETE CONSTRUCTION 9.105 FIGURE
- Page 861 and 862:
CONCRETE CONSTRUCTION 9.107 FIGURE
- Page 863 and 864:
CONCRETE CONSTRUCTION 9.109 2P u qs
- Page 865 and 866:
CONCRETE CONSTRUCTION 9.111 dicated
- Page 867 and 868:
CONCRETE CONSTRUCTION 9.113 FIGURE
- Page 869 and 870:
CONCRETE CONSTRUCTION 9.115 loads u
- Page 871 and 872:
CONCRETE CONSTRUCTION 9.117 C r �
- Page 873 and 874:
CONCRETE CONSTRUCTION 9.119 TABLE 9
- Page 875 and 876:
CONCRETE CONSTRUCTION 9.121 checked
- Page 877 and 878:
CONCRETE CONSTRUCTION 9.123 2. For
- Page 879 and 880:
CONCRETE CONSTRUCTION 9.125 FIGURE
- Page 881 and 882:
CONCRETE CONSTRUCTION 9.127 TABLE 9
- Page 883 and 884:
CONCRETE CONSTRUCTION 9.129 greates
- Page 885 and 886:
FIGURE 9.55 Reinforcement for deep
- Page 887 and 888:
CONCRETE CONSTRUCTION 9.133 � �
- Page 889 and 890:
FIGURE 9.58 Continuous cylindrical
- Page 891 and 892:
CONCRETE CONSTRUCTION 9.137 require
- Page 893 and 894:
CONCRETE CONSTRUCTION 9.139 crete s
- Page 895 and 896:
CONCRETE CONSTRUCTION 9.141 TABLE 9
- Page 897 and 898:
CONCRETE CONSTRUCTION 9.143 Forms r
- Page 899 and 900:
CONCRETE CONSTRUCTION 9.145 an uncr
- Page 901 and 902:
CONCRETE CONSTRUCTION 9.147 may be
- Page 903 and 904:
CONCRETE CONSTRUCTION 9.149 sions a
- Page 905 and 906:
CONCRETE CONSTRUCTION 9.151 Nonpres
- Page 907 and 908:
CONCRETE CONSTRUCTION 9.153 If the
- Page 909 and 910:
9.111 APPLICATION AND MEASUREMENT O
- Page 911 and 912:
10.2 TABLE 10.1 Shrinkage Values of
- Page 913 and 914:
10.4 SECTION TEN this structure, st
- Page 915 and 916:
10.6 SECTION TEN Use standard detai
- Page 917 and 918:
TABLE 10.4 Weights and Specific Gra
- Page 919 and 920:
10.10 SECTION TEN 10.3 DESIGN VALUE
- Page 921 and 922:
10.12 SECTION TEN Cr � repetitive
- Page 923 and 924:
10.14 SECTION TEN TABLE 10.6 Wet Se
- Page 925 and 926:
10.16 SECTION TEN 10.5.7 Flat-Use F
- Page 927 and 928:
10.18 SECTION TEN of loading. These
- Page 929 and 930:
10.20 SECTION TEN good joint detail
- Page 931 and 932:
10.22 SECTION TEN direction, deflec
- Page 933 and 934:
10.24 SECTION TEN Deflection of woo
- Page 935 and 936:
10.26 SECTION TEN multiplied by app
- Page 937 and 938:
10.28 SECTION TEN 10.8 WOOD COMPRES
- Page 939 and 940:
10.30 SECTION TEN smaller the slip
- Page 941 and 942:
10.32 SECTION TEN 2 FbE � KbEE�
- Page 943 and 944:
10.34 SECTION TEN A structural pane
- Page 945 and 946:
10.36 SECTION TEN panels, primarily
- Page 947 and 948:
10.38 SECTION TEN 10.12.5 Availabil
- Page 949 and 950:
10.40 SECTION TEN FIGURE 10.7 Subfl
- Page 951 and 952:
Panel siding Lap siding 10.42 TABLE
- Page 953 and 954:
10.44 SECTION TEN Building paper is
- Page 955 and 956:
10.46 TABLE 10.23 Maximum Shear, lb
- Page 957 and 958:
10.48 SECTION TEN FIGURE 10.10 Foun
- Page 959 and 960:
10.50 SECTION TEN TABLE 10.26 Minim
- Page 961 and 962:
10.52 TABLE 10.27 Maximum Shear, lb
- Page 963 and 964:
10.54 SECTION TEN 10.14.2 Wet-Servi
- Page 965 and 966:
10.56 SECTION TEN TABLE 10.30 Tempe
- Page 967 and 968:
10.58 SECTION TEN TABLE 10.32 Penet
- Page 969 and 970:
10.60 SECTION TEN FIGURE 10.12 Bolt
- Page 971 and 972:
10.62 SECTION TEN plates, embedded
- Page 973 and 974:
10.64 TABLE 10.37 Minimum Edge and
- Page 975 and 976:
10.66 SECTION TEN steel nails and s
- Page 977 and 978:
10.68 SECTION TEN FIGURE 10.15 Typi
- Page 979 and 980:
10.70 SECTION TEN Chord splices are
- Page 981 and 982:
10.72 SECTION TEN Horizontal framin
- Page 983 and 984:
10.74 SECTION TEN FIGURE 10.20 Crow
- Page 985 and 986:
10.76 SECTION TEN FIGURE 10.22 Typi
- Page 987 and 988:
10.78 SECTION TEN FIGURE 10.23 Plat
- Page 989 and 990:
10.80 SECTION TEN 10.26 PERMANENT W
- Page 991 and 992:
10.82 SECTION TEN Bearing values un
- Page 993 and 994:
10.84 SECTION TEN evacuation, fire
- Page 995 and 996:
10.86 SECTION TEN End Cuts. Unless
- Page 997 and 998:
10.88 SECTION TEN dapping, or drill
- Page 999 and 1000:
10.90 SECTION TEN Narrow boards may
- Page 1001 and 1002:
10.92 SECTION TEN wood species do n
- Page 1003 and 1004:
10.94 SECTION TEN In addition to ex
- Page 1005 and 1006:
11.2 SECTION ELEVEN MASONRY WALLS M
- Page 1007 and 1008:
11.4 SECTION ELEVEN FIGURE 11.1 Bri
- Page 1009 and 1010:
11.6 SECTION ELEVEN Design of load-
- Page 1011 and 1012:
11.8 SECTION ELEVEN For concrete bl
- Page 1013 and 1014:
11.10 SECTION ELEVEN Materials to b
- Page 1015 and 1016:
11.12 SECTION ELEVEN the ends of ti
- Page 1017 and 1018:
11.14 SECTION ELEVEN to distribute
- Page 1019 and 1020:
11.16 SECTION ELEVEN 11.4 LATERAL S
- Page 1021 and 1022:
11.18 SECTION ELEVEN FIGURE 11.9 An
- Page 1023 and 1024:
11.20 SECTION ELEVEN FIGURE 11.10 C
- Page 1025 and 1026:
11.22 SECTION ELEVEN saturation. Wh
- Page 1027 and 1028:
11.24 SECTION ELEVEN with metal anc
- Page 1029 and 1030:
11.26 SECTION ELEVEN TABLE 11.4 All
- Page 1031 and 1032:
11.28 SECTION ELEVEN TABLE 11.6 All
- Page 1033 and 1034:
11.30 SECTION ELEVEN Slenderness Co
- Page 1035 and 1036:
11.32 SECTION ELEVEN FIGURE 11.12 S
- Page 1037 and 1038:
11.34 SECTION ELEVEN FIGURE 11.15 (
- Page 1039 and 1040:
11.36 SECTION ELEVEN FIGURE 11.17 E
- Page 1041 and 1042:
11.38 SECTION ELEVEN 11.17 WOOD FAC
- Page 1043 and 1044:
11.40 SECTION ELEVEN be applied wit
- Page 1045 and 1046:
11.42 SECTION ELEVEN FIGURE 11.19 M
- Page 1047 and 1048:
11.44 SECTION ELEVEN in the followi
- Page 1049 and 1050:
11.46 SECTION ELEVEN Batten. A pred
- Page 1051 and 1052:
11.48 SECTION ELEVEN Corner Bead. A
- Page 1053 and 1054:
11.50 SECTION ELEVEN Gypsumboard. A
- Page 1055 and 1056:
11.52 SECTION ELEVEN Ship Lap. An o
- Page 1057 and 1058:
11.54 SECTION ELEVEN 11.25.2 Plaste
- Page 1059 and 1060:
11.56 SECTION ELEVEN Except at inte
- Page 1061 and 1062:
11.58 SECTION ELEVEN loops of 18-ga
- Page 1063 and 1064:
11.60 SECTION ELEVEN Veneer plaster
- Page 1065 and 1066:
11.62 SECTION ELEVEN Veneer plaster
- Page 1067 and 1068:
11.64 SECTION ELEVEN Furring. Suppl
- Page 1069 and 1070:
11.66 SECTION ELEVEN FIGURE 11.25 W
- Page 1071 and 1072:
11.68 SECTION ELEVEN TABLE 11.11 Ma
- Page 1073 and 1074:
11.70 SECTION ELEVEN The first step
- Page 1075 and 1076:
11.72 SECTION ELEVEN The joint shou
- Page 1077 and 1078:
11.74 SECTION ELEVEN masonry, or po
- Page 1079 and 1080:
11.76 SECTION ELEVEN may be 3 ⁄4
- Page 1081 and 1082:
11.78 SECTION ELEVEN 11.31 OTHER TY
- Page 1083 and 1084:
11.80 SECTION ELEVEN is practically
- Page 1085 and 1086:
11.82 SECTION ELEVEN Wood subfloors
- Page 1087 and 1088:
11.84 SECTION ELEVEN Because of the
- Page 1089 and 1090:
11.86 SECTION ELEVEN clay tiles and
- Page 1091 and 1092:
11.88 SECTION ELEVEN Check Rails. M
- Page 1093 and 1094:
11.90 SECTION ELEVEN FIGURE 11.31 D
- Page 1095 and 1096:
11.92 SECTION ELEVEN Hot-Dipped Gal
- Page 1097 and 1098:
11.94 SECTION ELEVEN TABLE 11.14 Re
- Page 1099 and 1100:
11.96 SECTION ELEVEN FIGURE 11.34 D
- Page 1101 and 1102:
11.98 SECTION ELEVEN commodation of
- Page 1103 and 1104:
11.100 SECTION ELEVEN FIGURE 11.37
- Page 1105 and 1106:
11.102 SECTION ELEVEN FIGURE 11.43
- Page 1107 and 1108:
11.104 SECTION ELEVEN FIGURE 11.47
- Page 1109 and 1110:
11.106 SECTION ELEVEN FIGURE 11.55
- Page 1111 and 1112:
11.108 SECTION ELEVEN FIGURE 11.59
- Page 1113 and 1114:
11.110 SECTION ELEVEN Hinge jambs o
- Page 1115 and 1116:
11.112 SECTION ELEVEN Control of Ai
- Page 1117 and 1118:
11.114 SECTION ELEVEN FIGURE 11.61
- Page 1119 and 1120:
11.116 SECTION ELEVEN FIGURE 11.63
- Page 1121 and 1122:
11.118 SECTION ELEVEN one rising up
- Page 1123 and 1124:
11.120 SECTION ELEVEN 11.56 REVOLVI
- Page 1125 and 1126:
11.122 SECTION ELEVEN FIGURE 11.68
- Page 1127 and 1128:
11.124 SECTION ELEVEN doors and win
- Page 1129 and 1130:
11.126 SECTION ELEVEN ANSI A156.4.
- Page 1131 and 1132:
11.128 SECTION ELEVEN 2. Nonrising
- Page 1133 and 1134:
11.130 SECTION ELEVEN it is importa
- Page 1135 and 1136:
11.132 SECTION ELEVEN When floor-ty
- Page 1137 and 1138:
11.134 SECTION ELEVEN that may be m
- Page 1139 and 1140:
11.136 SECTION ELEVEN The security
- Page 1141 and 1142:
11.138 SECTION ELEVEN Metal anchors
- Page 1143 and 1144:
11.140 SECTION ELEVEN FIGURE 11.84
- Page 1145 and 1146:
11.142 SECTION ELEVEN of the stud w
- Page 1147 and 1148:
11.144 SECTION ELEVEN 11.74 BOLTS A
- Page 1149 and 1150:
11.146 SECTION ELEVEN Velocity. Spe
- Page 1151 and 1152:
11.148 SECTION ELEVEN FIGURE 11.91
- Page 1153 and 1154:
11.150 SECTION ELEVEN p SPL � 20
- Page 1155 and 1156:
11.152 SECTION ELEVEN FIGURE 11.92
- Page 1157 and 1158:
11.154 SECTION ELEVEN Structural fl
- Page 1159 and 1160:
11.156 SECTION ELEVEN 11.79.4 Dampi
- Page 1161 and 1162:
11.158 SECTION ELEVEN binders or th
- Page 1163 and 1164:
11.160 SECTION ELEVEN Reverberation
- Page 1165 and 1166:
11.162 SECTION ELEVEN acoustical ce
- Page 1167 and 1168:
11.164 SECTION ELEVEN As might be e
- Page 1169 and 1170:
11.166 SECTION ELEVEN Acoustical Ab
- Page 1171 and 1172:
11.168 SECTION ELEVEN TABLE 11.35 T
- Page 1173 and 1174:
SECTION TWELVE ROOF SYSTEMS Dave Fl
- Page 1175 and 1176:
ROOF SYSTEMS 12.3 vapor in the inte
- Page 1177 and 1178:
ROOF SYSTEMS 12.5 it is the only ty
- Page 1179 and 1180:
ROOF SYSTEMS 12.7 Bitumen may be as
- Page 1181 and 1182:
ROOF SYSTEMS 12.9 FIGURE 12.4 Torch
- Page 1183 and 1184:
FIGURE 12.5 (Continued ) ROOF SYSTE
- Page 1185 and 1186:
FIGURE 12.7 Three-tab asphalt-shing
- Page 1187 and 1188:
ROOF SYSTEMS 12.15 Metal roof panel
- Page 1189 and 1190:
ROOF SYSTEMS 12.17 FIGURE 12.11 Woo
- Page 1191 and 1192:
ROOF SYSTEMS 12.19 a system that is
- Page 1193 and 1194:
12.14 EFFECTS OF WIND ON ROOFS ROOF
- Page 1195 and 1196:
ROOF SYSTEMS 12.23 inspections and
- Page 1197 and 1198:
American Society of Heating, Refrig
- Page 1199 and 1200:
Roof Consultants Institute (RCI) 74
- Page 1201 and 1202:
SECTION THIRTEEN HEATING, VENTILATI
- Page 1203 and 1204:
HEATING, VENTILATION, AND AIR CONDI
- Page 1205 and 1206:
HEATING, VENTILATION, AND AIR CONDI
- Page 1207 and 1208:
HEATING, VENTILATION, AND AIR CONDI
- Page 1209 and 1210:
13.2.3 Sensible Heat HEATING, VENTI
- Page 1211 and 1212:
HEATING, VENTILATION, AND AIR CONDI
- Page 1213 and 1214:
13.2.7 Enthalpy HEATING, VENTILATIO
- Page 1215 and 1216:
HEATING, VENTILATION, AND AIR CONDI
- Page 1217 and 1218:
HEATING, VENTILATION, AND AIR CONDI
- Page 1219 and 1220:
HEATING, VENTILATION, AND AIR CONDI
- Page 1221 and 1222:
HEATING, VENTILATION, AND AIR CONDI
- Page 1223 and 1224:
HEATING, VENTILATION, AND AIR CONDI
- Page 1225 and 1226:
HEATING, VENTILATION, AND AIR CONDI
- Page 1227 and 1228:
13.4 VENTILATION HEATING, VENTILATI
- Page 1229 and 1230:
HEATING, VENTILATION, AND AIR CONDI
- Page 1231 and 1232:
HEATING, VENTILATION, AND AIR CONDI
- Page 1233 and 1234:
HEATING, VENTILATION, AND AIR CONDI
- Page 1235 and 1236:
HEATING, VENTILATION, AND AIR CONDI
- Page 1237 and 1238:
HEATING, VENTILATION, AND AIR CONDI
- Page 1239 and 1240:
HEATING, VENTILATION, AND AIR CONDI
- Page 1241 and 1242:
HEATING, VENTILATION, AND AIR CONDI
- Page 1243 and 1244:
HEATING, VENTILATION, AND AIR CONDI
- Page 1245 and 1246:
13.11 WARM-AIR HEATING HEATING, VEN
- Page 1247 and 1248:
HEATING, VENTILATION, AND AIR CONDI
- Page 1249 and 1250:
HEATING, VENTILATION, AND AIR CONDI
- Page 1251 and 1252:
HEATING, VENTILATION, AND AIR CONDI
- Page 1253 and 1254:
HEATING, VENTILATION, AND AIR CONDI
- Page 1255 and 1256:
HEATING, VENTILATION, AND AIR CONDI
- Page 1257 and 1258:
HEATING, VENTILATION, AND AIR CONDI
- Page 1259 and 1260:
HEATING, VENTILATION, AND AIR CONDI
- Page 1261 and 1262:
HEATING, VENTILATION, AND AIR CONDI
- Page 1263 and 1264:
HEATING, VENTILATION, AND AIR CONDI
- Page 1265 and 1266:
HEATING, VENTILATION, AND AIR CONDI
- Page 1267 and 1268:
TABLE 13.15b First-Floor Office Loa
- Page 1269 and 1270:
HEATING, VENTILATION, AND AIR CONDI
- Page 1271 and 1272:
HEATING, VENTILATION, AND AIR CONDI
- Page 1273 and 1274:
HEATING, VENTILATION, AND AIR CONDI
- Page 1275 and 1276:
HEATING, VENTILATION, AND AIR CONDI
- Page 1277 and 1278:
HEATING, VENTILATION, AND AIR CONDI
- Page 1279 and 1280:
HEATING, VENTILATION, AND AIR CONDI
- Page 1281 and 1282:
HEATING, VENTILATION, AND AIR CONDI
- Page 1283 and 1284:
HEATING, VENTILATION, AND AIR CONDI
- Page 1285 and 1286:
13.32 AIR-WATER SYSTEMS HEATING, VE
- Page 1287 and 1288:
HEATING, VENTILATION, AND AIR CONDI
- Page 1289 and 1290:
HEATING, VENTILATION, AND AIR CONDI
- Page 1291 and 1292:
HEATING, VENTILATION, AND AIR CONDI
- Page 1293 and 1294:
HEATING, VENTILATION, AND AIR CONDI
- Page 1295 and 1296:
HEATING, VENTILATION, AND AIR CONDI
- Page 1297 and 1298:
14.2 SECTION FOURTEEN Code,’’ A
- Page 1299 and 1300:
14.4 SECTION FOURTEEN Publishing Co
- Page 1301 and 1302:
14.6 SECTION FOURTEEN detergents ar
- Page 1303 and 1304:
14.8 SECTION FOURTEEN 14.6.1 Temper
- Page 1305 and 1306:
14.10 SECTION FOURTEEN FIGURE 14.2
- Page 1307 and 1308:
14.12 SECTION FOURTEEN 14.6.7 Valve
- Page 1309 and 1310:
TABLE 14.2 Minimum Plumbing Fixture
- Page 1311 and 1312:
TABLE 14.2 Minimum Plumbing Fixture
- Page 1313 and 1314:
14.18 SECTION FOURTEEN of people ma
- Page 1315 and 1316:
14.20 SECTION FOURTEEN TABLE 14.3 M
- Page 1317 and 1318:
TABLE 14.4 Fixture Units and Trap a
- Page 1319 and 1320:
14.24 SECTION FOURTEEN FIGURE 14.4
- Page 1321 and 1322:
14.26 SECTION FOURTEEN FIGURE 14.6
- Page 1323 and 1324:
TABLE 14.5 Allowances for Friction
- Page 1325 and 1326:
14.30 SECTION FOURTEEN 2. Indirect
- Page 1327 and 1328:
TABLE 14.6 Hot-Water Demand per Fix
- Page 1329 and 1330:
14.34 SECTION FOURTEEN Storm water
- Page 1331 and 1332:
14.36 SECTION FOURTEEN Size and slo
- Page 1333 and 1334:
14.38 SECTION FOURTEEN hub; threade
- Page 1335 and 1336:
14.40 SECTION FOURTEEN to the build
- Page 1337 and 1338:
14.42 SECTION FOURTEEN TABLE 14.9 S
- Page 1339 and 1340:
TABLE 14.12 Size and Length of Vent
- Page 1341 and 1342:
14.46 SECTION FOURTEEN To ensure th
- Page 1343 and 1344:
14.48 SECTION FOURTEEN FIGURE 14.12
- Page 1345 and 1346:
14.50 SECTION FOURTEEN Besides muni
- Page 1347 and 1348:
14.52 SECTION FOURTEEN Polyethylene
- Page 1349 and 1350:
14.54 SECTION FOURTEEN FIGURE 14.14
- Page 1351 and 1352:
14.56 SECTION FOURTEEN FIGURE 14.16
- Page 1353 and 1354:
14.58 SECTION FOURTEEN The indicati
- Page 1355 and 1356:
14.60 SECTION FOURTEEN 14.29.2 Spri
- Page 1357 and 1358:
14.62 SECTION FOURTEEN FIGURE 14.21
- Page 1359 and 1360:
14.64 SECTION FOURTEEN limiting dev
- Page 1361 and 1362:
SECTION FIFTEEN ELECTRICAL SYSTEMS
- Page 1363 and 1364:
ELECTRICAL SYSTEMS 15.3 Resistance
- Page 1365 and 1366:
15.3 ALTERNATING-CURRENT SYSTEMS EL
- Page 1367 and 1368:
ELECTRICAL SYSTEMS 15.7 The magneti
- Page 1369 and 1370:
ELECTRICAL SYSTEMS 15.9 E � IZ co
- Page 1371 and 1372:
ELECTRICAL SYSTEMS 15.11 FIGURE 15.
- Page 1373 and 1374:
ELECTRICAL SYSTEMS 15.13 keeping th
- Page 1375 and 1376:
ELECTRICAL SYSTEMS 15.15 erator. Op
- Page 1377 and 1378:
15.6.3 Types of Insulated Conductor
- Page 1379 and 1380:
FIGURE 15.6 Cellular steel decking
- Page 1381 and 1382:
15.21 FIGURE 15.7 Space beneath a r
- Page 1383 and 1384:
ELECTRICAL SYSTEMS 15.23 All the se
- Page 1385 and 1386:
ELECTRICAL SYSTEMS 15.25 clearly ma
- Page 1387 and 1388:
ELECTRICAL SYSTEMS 15.27 customer u
- Page 1389 and 1390:
ELECTRICAL SYSTEMS 15.29 control th
- Page 1391 and 1392:
TABLE 15.1 Electrical Symbols* (Con
- Page 1393 and 1394:
ELECTRICAL SYSTEMS 15.33 CADD can m
- Page 1395 and 1396:
R � resistance, �/mil-ft c.m.
- Page 1397 and 1398:
TABLE 15.2 Protection of Single-Pha
- Page 1399 and 1400:
15.39 Horsepower TABLE 15.3 Protect
- Page 1401 and 1402:
ELECTRICAL SYSTEMS 15.41 starting c
- Page 1403 and 1404:
ELECTRICAL SYSTEMS 15.43 FIGURE 15.
- Page 1405 and 1406:
ELECTRICAL SYSTEMS 15.45 2 Three 40
- Page 1407 and 1408:
ELECTRICAL SYSTEMS 15.47 case, the
- Page 1409 and 1410:
15.10.5 Equivalent Spherical Illumi
- Page 1411 and 1412:
ELECTRICAL SYSTEMS 15.51 See also A
- Page 1413 and 1414:
ELECTRICAL SYSTEMS 15.53 Increase i
- Page 1415 and 1416:
ELECTRICAL SYSTEMS 15.55 restaurant
- Page 1417 and 1418:
ELECTRICAL SYSTEMS 15.57 TABLE 15.7
- Page 1419 and 1420:
ELECTRICAL SYSTEMS 15.59 the result
- Page 1421 and 1422:
ELECTRICAL SYSTEMS 15.61 acteristic
- Page 1423 and 1424:
ELECTRICAL SYSTEMS 15.63 For contro
- Page 1425 and 1426:
15.65 TABLE 15.9 Comparison of Lamp
- Page 1427 and 1428:
ELECTRICAL SYSTEMS 15.67 FIGURE 15.
- Page 1429 and 1430:
ELECTRICAL SYSTEMS 15.69 Some lumin
- Page 1431 and 1432:
ELECTRICAL SYSTEMS 15.71 To adjust
- Page 1433 and 1434:
ELECTRICAL SYSTEMS 15.73 Similar co
- Page 1435 and 1436:
ELECTRICAL SYSTEMS 15.75 exchange (
- Page 1437 and 1438:
ELECTRICAL SYSTEMS 15.77 protection
- Page 1439 and 1440:
SECTION SIXTEEN VERTICAL CIRCULATIO
- Page 1441 and 1442:
VERTICAL CIRCULATION 16.3 ft 2 . Ra
- Page 1443 and 1444:
VERTICAL CIRCULATION 16.5 Facilitie
- Page 1445 and 1446:
16.3.3 Design Loads for Stairs VERT
- Page 1447 and 1448:
VERTICAL CIRCULATION 16.9 Stairs ou
- Page 1449 and 1450:
FIGURE 16.5 Reinforced concrete sta
- Page 1451 and 1452:
VERTICAL CIRCULATION 16.13 FIGURE 1
- Page 1453 and 1454:
VERTICAL CIRCULATION 16.15 most att
- Page 1455 and 1456:
VERTICAL CIRCULATION 16.17 FIGURE 1
- Page 1457 and 1458:
VERTICAL CIRCULATION 16.19 FIGURE 1
- Page 1459 and 1460:
VERTICAL CIRCULATION 16.21 Hoistway
- Page 1461 and 1462:
VERTICAL CIRCULATION 16.23 enclosur
- Page 1463 and 1464:
VERTICAL CIRCULATION 16.25 horizont
- Page 1465 and 1466: VERTICAL CIRCULATION 16.27 car is r
- Page 1467 and 1468: VERTICAL CIRCULATION 16.29 and lowe
- Page 1469 and 1470: VERTICAL CIRCULATION 16.31 car-spee
- Page 1471 and 1472: VERTICAL CIRCULATION 16.33 Also, th
- Page 1473 and 1474: VERTICAL CIRCULATION 16.35 An autom
- Page 1475 and 1476: VERTICAL CIRCULATION 16.37 For long
- Page 1477 and 1478: VERTICAL CIRCULATION 16.39 Another
- Page 1479 and 1480: 16.11.5 Professional-Building Eleva
- Page 1481 and 1482: VERTICAL CIRCULATION 16.43 FIGURE 1
- Page 1483 and 1484: VERTICAL CIRCULATION 16.45 horizont
- Page 1485 and 1486: VERTICAL CIRCULATION 16.47 limited
- Page 1487 and 1488: 17.2 SECTION SEVENTEEN to be a good
- Page 1489 and 1490: 17.4 SECTION SEVENTEEN the contract
- Page 1491 and 1492: 17.6 SECTION SEVENTEEN 17.3 CONTRAC
- Page 1493 and 1494: 17.8 SECTION SEVENTEEN Private Cont
- Page 1495 and 1496: 17.10 SECTION SEVENTEEN FIGURE 17.2
- Page 1497 and 1498: 17.12 SECTION SEVENTEEN intend to a
- Page 1499 and 1500: 17.14 SECTION SEVENTEEN purposes. I
- Page 1501 and 1502: 17.16 SECTION SEVENTEEN 4. The CM a
- Page 1503 and 1504: 17.18 SECTION SEVENTEEN FIGURE 17.5
- Page 1505 and 1506: 17.20 SECTION SEVENTEEN FIGURE 17.6
- Page 1507 and 1508: 17.22 SECTION SEVENTEEN FIGURE 17.8
- Page 1509 and 1510: 17.24 SECTION SEVENTEEN Purchasing/
- Page 1511 and 1512: 17.26 SECTION SEVENTEEN FIGURE 17.1
- Page 1513 and 1514: 17.28 SECTION SEVENTEEN serving dec
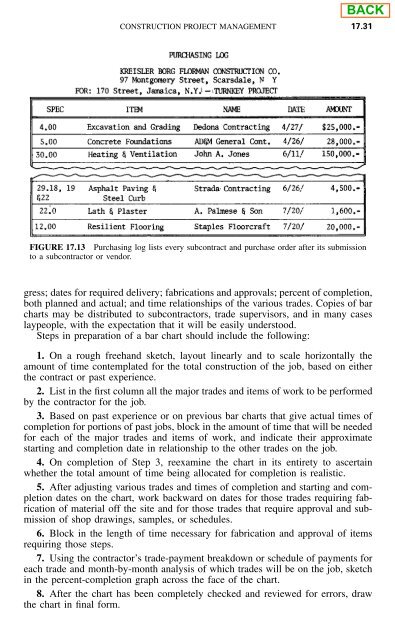
- Page 1515: 17.30 SECTION SEVENTEEN FIGURE 17.1
- Page 1519 and 1520: 17.34 SECTION SEVENTEEN pass contin
- Page 1521 and 1522: 17.36 SECTION SEVENTEEN This may ne
- Page 1523 and 1524: 17.38 SECTION SEVENTEEN When work i
- Page 1525 and 1526: 17.40 SECTION SEVENTEEN work or to
- Page 1527 and 1528: 17.42 SECTION SEVENTEEN Mediation.
- Page 1529 and 1530: 17.44 SECTION SEVENTEEN TABLE 17.1
- Page 1531 and 1532: 17.46 SECTION SEVENTEEN TABLE 17.1
- Page 1533 and 1534: 17.48 SECTION SEVENTEEN 17.15.3 Mot
- Page 1535 and 1536: 17.50 SECTION SEVENTEEN independent
- Page 1537 and 1538: 17.52 SECTION SEVENTEEN merchandise
- Page 1539 and 1540: 17.54 SECTION SEVENTEEN 1. A comple
- Page 1541 and 1542: 17.56 SECTION SEVENTEEN retainage t
- Page 1543 and 1544: 17.58 SECTION SEVENTEEN FIGURE 17.2
- Page 1545 and 1546: 17.60 FIGURE 17.23 Monthly cost rep
- Page 1547 and 1548: 17.62 SECTION SEVENTEEN this method
- Page 1549 and 1550: 17.64 SECTION SEVENTEEN salaried li
- Page 1551 and 1552: 17.66 SECTION SEVENTEEN heat. Stand
- Page 1553 and 1554: 17.68 SECTION SEVENTEEN or three-sh
- Page 1555 and 1556: 17.70 SECTION SEVENTEEN The lessons
- Page 1557 and 1558: 18.2 SECTION EIGHTEEN the local uti
- Page 1559 and 1560: 18.4 SECTION EIGHTEEN nized steel (
- Page 1561 and 1562: 18.6 SECTION EIGHTEEN building cons
- Page 1563 and 1564: 18.8 SECTION EIGHTEEN tenant’s re
- Page 1565 and 1566: 18.10 SECTION EIGHTEEN 18.3 COMMUNI
- Page 1567 and 1568:
18.12 SECTION EIGHTEEN FIGURE 18.4
- Page 1569 and 1570:
18.14 SECTION EIGHTEEN FIGURE 18.7
- Page 1571 and 1572:
18.16 SECTION EIGHTEEN FIGURE 18.10
- Page 1573 and 1574:
18.18 SECTION EIGHTEEN FIGURE 18.14
- Page 1575 and 1576:
18.20 SECTION EIGHTEEN FIGURE 18.17
- Page 1577 and 1578:
18.22 SECTION EIGHTEEN FIGURE 18.21
- Page 1579 and 1580:
18.24 SECTION EIGHTEEN a 120/240 V,
- Page 1581 and 1582:
18.26 SECTION EIGHTEEN 18.9 LINKS A
- Page 1583 and 1584:
19.2 SECTION NINETEEN the course of
- Page 1585 and 1586:
19.4 SECTION NINETEEN Fixed-Price E
- Page 1587 and 1588:
19.6 SECTION NINETEEN differs from
- Page 1589 and 1590:
19.8 SECTION NINETEEN 19.4 ESTIMATI
- Page 1591 and 1592:
19.10 SECTION NINETEEN FIGURE 19.1
- Page 1593 and 1594:
TABLE 19.2 Equipment Ownership and
- Page 1595 and 1596:
19.14 SECTION NINETEEN 2. By time c
- Page 1597 and 1598:
APPENDIX FACTORS FOR CONVERSION TO
- Page 1599 and 1600:
TABLE A.3 Derived SI Units with Spe
- Page 1601 and 1602:
TABLE A.4 Some Common Derived Units
- Page 1603 and 1604:
APPENDIX A.7 mass. In such cases, t
- Page 1605 and 1606:
TABLE A.6 Factors for Conversion to
- Page 1607 and 1608:
APPENDIX A.11 TABLE A.6 Factors for
- Page 1609 and 1610:
APPENDIX A.13 TABLE A.6 Factors for
- Page 1611 and 1612:
Index Terms Links Aggregates: cont.
- Page 1613 and 1614:
Index Terms Links Aluminum: alloys
- Page 1615 and 1616:
Index Terms Links ASD 7.44 (See als
- Page 1617 and 1618:
Index Terms Links Beams: cont. flex
- Page 1619 and 1620:
Index Terms Links Bids: cont. mater
- Page 1621 and 1622:
Index Terms Links Bracing: of beams
- Page 1623 and 1624:
Index Terms Links Building codes (s
- Page 1625 and 1626:
Index Terms Links Cable-supported s
- Page 1627 and 1628:
Index Terms Links Coatings: bibliog
- Page 1629 and 1630:
Index Terms Links Columns: stress-s
- Page 1631 and 1632:
Index Terms Links Concrete: cont. f
- Page 1633 and 1634:
Index Terms Links Concrete admixtur
- Page 1635 and 1636:
Index Terms Links Concrete floors:
- Page 1637 and 1638:
Index Terms Links Connections: cont
- Page 1639 and 1640:
Index Terms Links Construction cont
- Page 1641 and 1642:
Index Terms Links Contractors, home
- Page 1643 and 1644:
Index Terms Links Cost estimates: c
- Page 1645 and 1646:
Index Terms Links Derricks 7.117 De
- Page 1647 and 1648:
Index Terms Links Drinking fountain
- Page 1649 and 1650:
Index Terms Links Electrical circui
- Page 1651 and 1652:
Index Terms Links Elevators: cont.
- Page 1653 and 1654:
Index Terms Links Emergency egress
- Page 1655 and 1656:
Index Terms Links Fire: cont. elect
- Page 1657 and 1658:
Index Terms Links Floor fill 5.5 Fl
- Page 1659 and 1660:
Index Terms Links Foundations: basi
- Page 1661 and 1662:
Index Terms Links Furring 11.49 11.
- Page 1663 and 1664:
Index Terms Links Gypsumboard: cont
- Page 1665 and 1666:
Index Terms Links Heat: balancing o
- Page 1667 and 1668:
Index Terms Links HVAC: computerize
- Page 1669 and 1670:
Index Terms Links Jambs: door 11.11
- Page 1671 and 1672:
Index Terms Links Lighting: brightn
- Page 1673 and 1674:
Index Terms Links Louvers 13.5 Lrfd
- Page 1675 and 1676:
Index Terms Links Luminaires: candl
- Page 1677 and 1678:
Index Terms Links Matrices: advanta
- Page 1679 and 1680:
Index Terms Links Nominal scale 1.2
- Page 1681 and 1682:
Index Terms Links Pipe: corrosion p
- Page 1683 and 1684:
Index Terms Links Plastics: cont. p
- Page 1685 and 1686:
Index Terms Links Plywood: cont. st
- Page 1687 and 1688:
Index Terms Links Reactors, current
- Page 1689 and 1690:
Index Terms Links Roofing: cont. wa
- Page 1691 and 1692:
Shear: in beams: Index Terms Links
- Page 1693 and 1694:
Index Terms Links Sills: door 11.11
- Page 1695 and 1696:
Index Terms Links Soils: cont. with
- Page 1697 and 1698:
Index Terms Links Spikes 10.54 10.5
- Page 1699 and 1700:
Index Terms Links Steel beams: cont
- Page 1701 and 1702:
Index Terms Links Steel reinforceme
- Page 1703 and 1704:
Index Terms Links Storm water: disp
- Page 1705 and 1706:
Index Terms Links Structural steels
- Page 1707 and 1708:
Index Terms Links Subsurface explor
- Page 1709 and 1710:
Index Terms Links Systems design: c
- Page 1711 and 1712:
Index Terms Links Treads 16.6 16.7
- Page 1713 and 1714:
Index Terms Links Vibrations: cont.
- Page 1715 and 1716:
Index Terms Links Walls: cont. sand
- Page 1717 and 1718:
Index Terms Links Welding: cont. st
- Page 1719 and 1720:
Index Terms Links Windows: cont. st
- Page 1721:
Index Terms Links Wood joists 5.4 1