

Solar Energy Perspectives - IEA
Solar Energy Perspectives - IEA
Solar Energy Perspectives - IEA

You also want an ePaper? Increase the reach of your titles
YUMPU automatically turns print PDFs into web optimized ePapers that Google loves.
<strong>Solar</strong> <strong>Energy</strong> <strong>Perspectives</strong>: <strong>Solar</strong> photovoltaics<br />
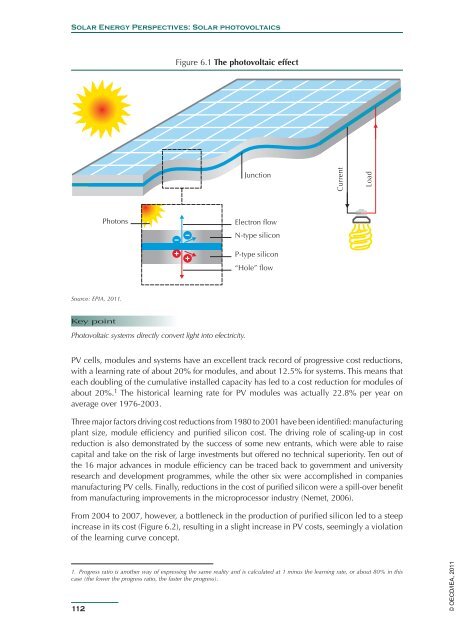
Figure 6.1 The photovoltaic effect<br />
Junction<br />
Current<br />
Load<br />
Photons<br />
Electron flow<br />
N-type silicon<br />
P-type silicon<br />
“Hole” flow<br />
Source: EPIA, 2011.<br />
Key point<br />
Photovoltaic systems directly convert light into electricity.<br />
PV cells, modules and systems have an excellent track record of progressive cost reductions,<br />
with a learning rate of about 20% for modules, and about 12.5% for systems. This means that<br />
each doubling of the cumulative installed capacity has led to a cost reduction for modules of<br />
about 20%. 1 The historical learning rate for PV modules was actually 22.8% per year on<br />
average over 1976-2003.<br />
Three major factors driving cost reductions from 1980 to 2001 have been identified: manufacturing<br />
plant size, module efficiency and purified silicon cost. The driving role of scaling-up in cost<br />
reduction is also demonstrated by the success of some new entrants, which were able to raise<br />
capital and take on the risk of large investments but offered no technical superiority. Ten out of<br />
the 16 major advances in module efficiency can be traced back to government and university<br />
research and development programmes, while the other six were accomplished in companies<br />
manufacturing PV cells. Finally, reductions in the cost of purified silicon were a spill-over benefit<br />
from manufacturing improvements in the microprocessor industry (Nemet, 2006).<br />
From 2004 to 2007, however, a bottleneck in the production of purified silicon led to a steep<br />
increase in its cost (Figure 6.2), resulting in a slight increase in PV costs, seemingly a violation<br />
of the learning curve concept.<br />
1. Progress ratio is another way of expressing the same reality and is calculated at 1 minus the learning rate, or about 80% in this<br />
case (the lower the progress ratio, the faster the progress).<br />
112<br />
© OECD/<strong>IEA</strong>, 2011


