

Solar Energy Perspectives - IEA
Solar Energy Perspectives - IEA
Solar Energy Perspectives - IEA

You also want an ePaper? Increase the reach of your titles
YUMPU automatically turns print PDFs into web optimized ePapers that Google loves.
Chapter 4: Buildings<br />
South Africa, electric water heating accounts for one-third of the power consumption of the<br />
average household. The government has identified the massive deployment of solar water<br />
heaters as one effective option to avoid electricity shortages, and launched a programme to<br />
install one million solar water heaters by 2014 (Photo 4.3). When large regions are compared,<br />
China is the market leader not only in absolute terms but also on a per capita basis, followed<br />
for the first time in 2009 by the Middle East.<br />
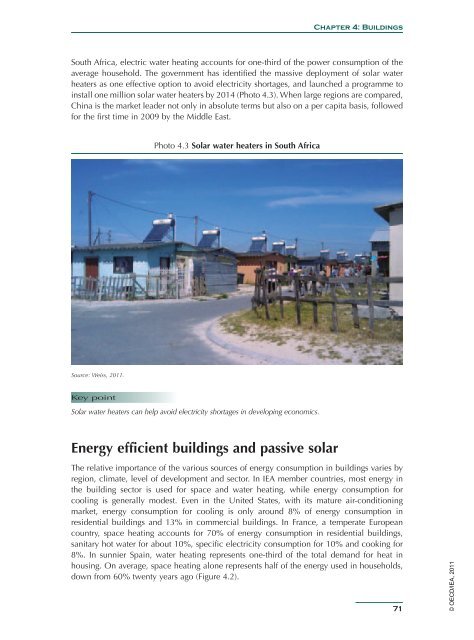
Photo 4.3 <strong>Solar</strong> water heaters in South Africa<br />
Source: Weiss, 2011.<br />
Key point<br />
<strong>Solar</strong> water heaters can help avoid electricity shortages in developing economics.<br />
<strong>Energy</strong> efficient buildings and passive solar<br />
The relative importance of the various sources of energy consumption in buildings varies by<br />
region, climate, level of development and sector. In <strong>IEA</strong> member countries, most energy in<br />
the building sector is used for space and water heating, while energy consumption for<br />
cooling is generally modest. Even in the United States, with its mature air-conditioning<br />
market, energy consumption for cooling is only around 8% of energy consumption in<br />
residential buildings and 13% in commercial buildings. In France, a temperate European<br />
country, space heating accounts for 70% of energy consumption in residential buildings,<br />
sanitary hot water for about 10%, specific electricity consumption for 10% and cooking for<br />
8%. In sunnier Spain, water heating represents one-third of the total demand for heat in<br />
housing. On average, space heating alone represents half of the energy used in households,<br />
down from 60% twenty years ago (Figure 4.2).<br />
71<br />
© OECD/<strong>IEA</strong>, 2011


