

Solar Energy Perspectives - IEA
Solar Energy Perspectives - IEA
Solar Energy Perspectives - IEA

Create successful ePaper yourself
Turn your PDF publications into a flip-book with our unique Google optimized e-Paper software.
<strong>Solar</strong> <strong>Energy</strong> <strong>Perspectives</strong>: Policies<br />
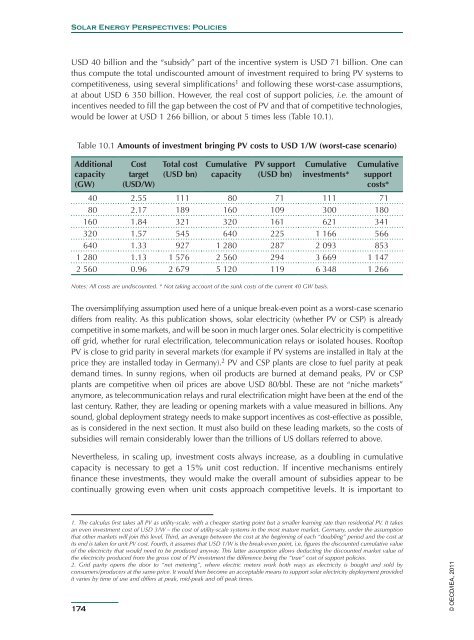
USD 40 billion and the “subsidy” part of the incentive system is USD 71 billion. One can<br />
thus compute the total undiscounted amount of investment required to bring PV systems to<br />
competitiveness, using several simplifications 1 and following these worst-case assumptions,<br />
at about USD 6 350 billion. However, the real cost of support policies, i.e. the amount of<br />
incentives needed to fill the gap between the cost of PV and that of competitive technologies,<br />
would be lower at USD 1 266 billion, or about 5 times less (Table 10.1).<br />
Table 10.1 Amounts of investment bringing PV costs to USD 1/W (worst-case scenario)<br />
Additional<br />
capacity<br />
(GW)<br />
Cost<br />
target<br />
(USD/W)<br />
Total cost<br />
(USD bn)<br />
Cumulative<br />
capacity<br />
PV support<br />
(USD bn)<br />
Cumulative<br />
investments*<br />
Cumulative<br />
support<br />
costs*<br />
40 2.55 111 80 71 111 71<br />
80 2.17 189 160 109 300 180<br />
160 1.84 321 320 161 621 341<br />
320 1.57 545 640 225 1 166 566<br />
640 1.33 927 1 280 287 2 093 853<br />
1 280 1.13 1 576 2 560 294 3 669 1 147<br />
2 560 0.96 2 679 5 120 119 6 348 1 266<br />
Notes: All costs are undiscounted. * Not taking account of the sunk costs of the current 40 GW basis.<br />
The oversimplifying assumption used here of a unique break-even point as a worst-case scenario<br />
differs from reality. As this publication shows, solar electricity (whether PV or CSP) is already<br />
competitive in some markets, and will be soon in much larger ones. <strong>Solar</strong> electricity is competitive<br />
off grid, whether for rural electrification, telecommunication relays or isolated houses. Rooftop<br />
PV is close to grid parity in several markets (for example if PV systems are installed in Italy at the<br />
price they are installed today in Germany). 2 PV and CSP plants are close to fuel parity at peak<br />
demand times. In sunny regions, when oil products are burned at demand peaks, PV or CSP<br />
plants are competitive when oil prices are above USD 80/bbl. These are not “niche markets”<br />
anymore, as telecommunication relays and rural electrification might have been at the end of the<br />
last century. Rather, they are leading or opening markets with a value measured in billions. Any<br />
sound, global deployment strategy needs to make support incentives as cost-effective as possible,<br />
as is considered in the next section. It must also build on these leading markets, so the costs of<br />
subsidies will remain considerably lower than the trillions of US dollars referred to above.<br />
Nevertheless, in scaling up, investment costs always increase, as a doubling in cumulative<br />
capacity is necessary to get a 15% unit cost reduction. If incentive mechanisms entirely<br />
finance these investments, they would make the overall amount of subsidies appear to be<br />
continually growing even when unit costs approach competitive levels. It is important to<br />
1. The calculus first takes all PV as utility-scale, with a cheaper starting point but a smaller learning rate than residential PV. It takes<br />
an even investment cost of USD 3/W – the cost of utility-scale systems in the most mature market, Germany, under the assumption<br />
that other markets will join this level. Third, an average between the cost at the beginning of each “doubling” period and the cost at<br />
its end is taken for unit PV cost. Fourth, it assumes that USD 1/W is the break-even point, i.e. figures the discounted cumulative value<br />
of the electricity that would need to be produced anyway. This latter assumption allows deducting the discounted market value of<br />
the electricity produced from the gross cost of PV investment the difference being the “true” cost of support policies.<br />
2. Grid parity opens the door to “net metering”, where electric meters work both ways as electricity is bought and sold by<br />
consumers/producers at the same price. It would then become an acceptable means to support solar electricity deployment provided<br />
it varies by time of use and differs at peak, mid-peak and off peak times.<br />
174<br />
© OECD/<strong>IEA</strong>, 2011


