

Solar Energy Perspectives - IEA
Solar Energy Perspectives - IEA
Solar Energy Perspectives - IEA

Create successful ePaper yourself
Turn your PDF publications into a flip-book with our unique Google optimized e-Paper software.
<strong>Solar</strong> <strong>Energy</strong> <strong>Perspectives</strong>: The solar resource and its possible uses<br />
Roughly half of the radiation scattered is lost to outer space, the remainder is directed<br />
towards the earth’s surface from all directions (diffuse radiation). The amount of energy<br />
reflected, scattered and absorbed depends on the length the sun’s rays must travel, as well as<br />
the levels of dust particles and water vapour – and of course the clouds – they meet. Smaller<br />
cosine effect and air mass make the inter-tropical zone sunnier than others. However, the<br />
global radiation reaching the earth’s surface is much stronger in arid or semi-arid zones than<br />
in tropical or equatorial humid zones (Figure 2.7). These zones are usually found on the west<br />
sides of the continents around the tropics, but not close to the equator.<br />
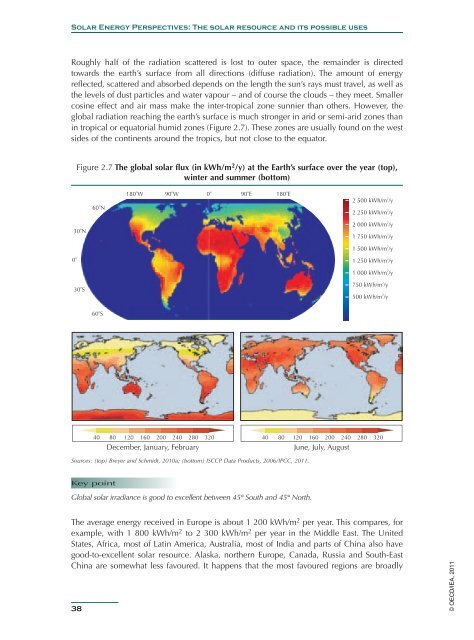
Figure 2.7 The global solar flux (in kWh/m 2 /y) at the Earth’s surface over the year (top),<br />
winter and summer (bottom)<br />
180 o<br />
W 90 o<br />
W 0 o<br />
90 o<br />
E<br />
60 o<br />
N<br />
30 o<br />
N<br />
0 o<br />
30 o<br />
S<br />
180 o<br />
E<br />
2 500 kWh/m 2 /y<br />
2 250 kWh/m 2 /y<br />
2 000 kWh/m 2 /y<br />
1 750 kWh/m 2 /y<br />
1 500 kWh/m 2 /y<br />
1 250 kWh/m 2 /y<br />
1 000 kWh/m 2 /y<br />
750 kWh/m 2 /y<br />
500 kWh/m 2 /y<br />
60 o<br />
S<br />
40 80 120 160 200 240 280 320 40 80 120 160 200 240 280 320<br />
December, January, February<br />
June, July, August<br />
Sources: (top) Breyer and Schmidt, 2010a; (bottom) ISCCP Data Products, 2006/IPCC, 2011.<br />
Key point<br />
Global solar irradiance is good to excellent between 45° South and 45° North.<br />
The average energy received in Europe is about 1 200 kWh/m 2 per year. This compares, for<br />
example, with 1 800 kWh/m 2 to 2 300 kWh/m 2 per year in the Middle East. The United<br />
States, Africa, most of Latin America, Australia, most of India and parts of China also have<br />
good-to-excellent solar resource. Alaska, northern Europe, Canada, Russia and South-East<br />
China are somewhat less favoured. It happens that the most favoured regions are broadly<br />
38<br />
© OECD/<strong>IEA</strong>, 2011


