

Solar Energy Perspectives - IEA
Solar Energy Perspectives - IEA
Solar Energy Perspectives - IEA

Create successful ePaper yourself
Turn your PDF publications into a flip-book with our unique Google optimized e-Paper software.
Chapter 10: Policies<br />
ambition of the initial programme. They totalled 62% of the added capacity, the remainder<br />
being provided by less than 1 200 larger installations.<br />
As a result, the supply curve seems rather flat, reflecting considerable potential at a given<br />
cost. Controlling quantities would require a very precise price setting in an uncertain and<br />
ever-changing economic environment. At any time, the incentive level risks being either “too<br />
high”, not generating too-high returns to investors but driving more PV investments in PV<br />
than wished, or “too low” and much less investment than desired will take place. The<br />
difficulty is illustrated in Figure 10.6.<br />
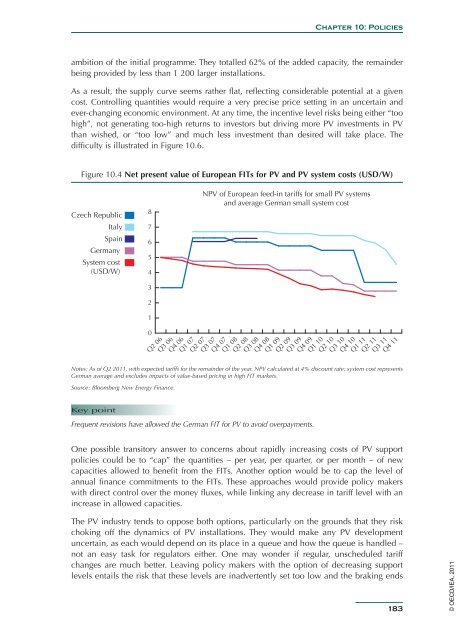
Figure 10.4 Net present value of European FITs for PV and PV system costs (USD/W)<br />
Czech Republic<br />
Italy<br />
Spain<br />
Germany<br />
System cost<br />
(USD/W)<br />
Notes: As of Q2 2011, with expected tariffs for the remainder of the year. NPV calculated at 4% discount rate; system cost represents<br />
German average and excludes impacts of value-based pricing in high FIT markets.<br />
Source: Bloomberg New <strong>Energy</strong> Finance.<br />
Key point<br />
8<br />
7<br />
6<br />
5<br />
4<br />
3<br />
2<br />
1<br />
0<br />
Q2 06<br />
Q3 06<br />
Q4 06<br />
Q1 07<br />
NPV of European feed-in tariffs for small PV systems<br />
and average German small system cost<br />
Frequent revisions have allowed the German FIT for PV to avoid overpayments.<br />
Q2 07<br />
Q3 07<br />
Q4 07<br />
Q1 08<br />
Q2 08<br />
Q3 08<br />
Q4 08<br />
Q1 09<br />
Q2 09<br />
Q3 09<br />
Q4 09<br />
Q1 10<br />
Q2 10<br />
Q3 10<br />
Q4 10<br />
Q1 11<br />
Q2 11<br />
Q3 11<br />
Q4 11<br />
One possible transitory answer to concerns about rapidly increasing costs of PV support<br />
policies could be to “cap” the quantities – per year, per quarter, or per month – of new<br />
capacities allowed to benefit from the FITs. Another option would be to cap the level of<br />
annual finance commitments to the FITs. These approaches would provide policy makers<br />
with direct control over the money fluxes, while linking any decrease in tariff level with an<br />
increase in allowed capacities.<br />
The PV industry tends to oppose both options, particularly on the grounds that they risk<br />
choking off the dynamics of PV installations. They would make any PV development<br />
uncertain, as each would depend on its place in a queue and how the queue is handled –<br />
not an easy task for regulators either. One may wonder if regular, unscheduled tariff<br />
changes are much better. Leaving policy makers with the option of decreasing support<br />
levels entails the risk that these levels are inadvertently set too low and the braking ends<br />
183<br />
© OECD/<strong>IEA</strong>, 2011


