

Solar Energy Perspectives - IEA
Solar Energy Perspectives - IEA
Solar Energy Perspectives - IEA

You also want an ePaper? Increase the reach of your titles
YUMPU automatically turns print PDFs into web optimized ePapers that Google loves.
Chapter 3: <strong>Solar</strong> electricity<br />
New information on actual solar resource suggests Central Asia may be less favourable than<br />
expected, while the role CSP could play in China might have been assessed too cautiously.<br />
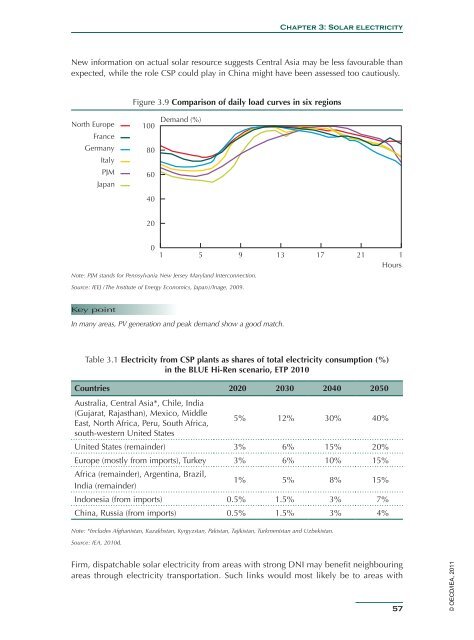
Figure 3.9 Comparison of daily load curves in six regions<br />
North Europe<br />
France<br />
Germany<br />
Italy<br />
PJM<br />
Japan<br />
100<br />
80<br />
60<br />
40<br />
Demand (%)<br />
20<br />
0<br />
1 5 9 13 17 21 1<br />
Note: PJM stands for Pennsylvania New Jersey Maryland Interconnection.<br />
Source: IEEJ (The Institute of <strong>Energy</strong> Economics, Japan)/Inage, 2009.<br />
Hours<br />
Key point<br />
In many areas, PV generation and peak demand show a good match.<br />
Table 3.1 Electricity from CSP plants as shares of total electricity consumption (%)<br />
in the BLUE Hi-Ren scenario, ETP 2010<br />
Countries 2020 2030 2040 2050<br />
Australia, Central Asia*, Chile, India<br />
(Gujarat, Rajasthan), Mexico, Middle<br />
East, North Africa, Peru, South Africa,<br />
5% 12% 30% 40%<br />
south-western United States<br />
United States (remainder) 3% 6% 15% 20%<br />
Europe (mostly from imports), Turkey 3% 6% 10% 15%<br />
Africa (remainder), Argentina, Brazil,<br />
India (remainder)<br />
1% 5% 8% 15%<br />
Indonesia (from imports) 0.5% 1.5% 3% 7%<br />
China, Russia (from imports) 0.5% 1.5% 3% 4%<br />
Note: *Includes Afghanistan, Kazakhstan, Kyrgyzstan, Pakistan, Tajikistan, Turkmenistan and Uzbekistan.<br />
Source: <strong>IEA</strong>, 2010d.<br />
Firm, dispatchable solar electricity from areas with strong DNI may benefit neighbouring<br />
areas through electricity transportation. Such links would most likely be to areas with<br />
57<br />
© OECD/<strong>IEA</strong>, 2011


