

Solar Energy Perspectives - IEA
Solar Energy Perspectives - IEA
Solar Energy Perspectives - IEA

Create successful ePaper yourself
Turn your PDF publications into a flip-book with our unique Google optimized e-Paper software.
Chapter 3: <strong>Solar</strong> electricity<br />
peak times is always costlier than base load electricity generation. In sunny and warm<br />
countries, the sunniest hours of the day usually correspond to the peak or mid-peak demand,<br />
but supply may or may not be priced high enough to reflect the full costs.<br />
Electricity generation costs (USD per MWh)<br />
400<br />
Establishment of PV industrial<br />
mass production<br />
350<br />
PV residential<br />
300<br />
250<br />
200<br />
150<br />
100<br />
PV utility 2 000 kWh/kW<br />
BLUE Map retail<br />
electricity costs<br />
1 500 kWh/kW<br />
BLUE Map wholesale electricity costs<br />
50<br />
st<br />
1 competitiveness level<br />
0<br />
2010 2015 2020<br />
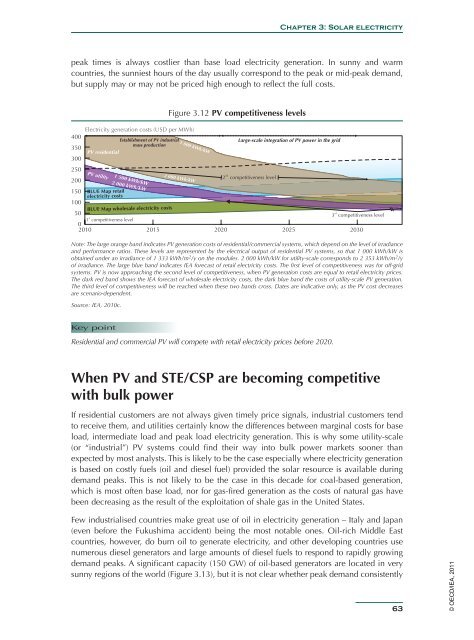
Figure 3.12 PV competitiveness levels<br />
1 000 kWh/kW<br />
2 000 kWh/kW<br />
Large-scale integration of PV power in the grid<br />
nd<br />
2 competitiveness level<br />
rd<br />
3 competitiveness level<br />
2025 2030<br />
Note: The large orange band indicates PV generation costs of residential/commercial systems, which depend on the level of irradiance<br />
and performance ratios. These levels are represented by the electrical output of residential PV systems, so that 1 000 kWh/kW is<br />
obtained under an irradiance of 1 333 kWh/m 2 /y on the modules. 2 000 kWh/kW for utility-scale corresponds to 2 353 kWh/m 2 /y<br />
of irradiance. The large blue band indicates <strong>IEA</strong> forecast of retail electricity costs. The first level of competitiveness was for off-grid<br />
systems. PV is now approaching the second level of competitiveness, when PV generation costs are equal to retail electricity prices.<br />
The dark red band shows the <strong>IEA</strong> forecast of wholesale electricity costs, the dark blue band the costs of utility-scale PV generation.<br />
The third level of competitiveness will be reached when these two bands cross. Dates are indicative only, as the PV cost decreases<br />
are scenario-dependent.<br />
Source: <strong>IEA</strong>, 2010c.<br />
Key point<br />
Residential and commercial PV will compete with retail electricity prices before 2020.<br />
When PV and STE/CSP are becoming competitive<br />
with bulk power<br />
If residential customers are not always given timely price signals, industrial customers tend<br />
to receive them, and utilities certainly know the differences between marginal costs for base<br />
load, intermediate load and peak load electricity generation. This is why some utility-scale<br />
(or “industrial”) PV systems could find their way into bulk power markets sooner than<br />
expected by most analysts. This is likely to be the case especially where electricity generation<br />
is based on costly fuels (oil and diesel fuel) provided the solar resource is available during<br />
demand peaks. This is not likely to be the case in this decade for coal-based generation,<br />
which is most often base load, nor for gas-fired generation as the costs of natural gas have<br />
been decreasing as the result of the exploitation of shale gas in the United States.<br />
Few industrialised countries make great use of oil in electricity generation – Italy and Japan<br />
(even before the Fukushima accident) being the most notable ones. Oil-rich Middle East<br />
countries, however, do burn oil to generate electricity, and other developing countries use<br />
numerous diesel generators and large amounts of diesel fuels to respond to rapidly growing<br />
demand peaks. A significant capacity (150 GW) of oil-based generators are located in very<br />
sunny regions of the world (Figure 3.13), but it is not clear whether peak demand consistently<br />
63<br />
© OECD/<strong>IEA</strong>, 2011


