

Solar Energy Perspectives - IEA
Solar Energy Perspectives - IEA
Solar Energy Perspectives - IEA

Create successful ePaper yourself
Turn your PDF publications into a flip-book with our unique Google optimized e-Paper software.
<strong>Solar</strong> <strong>Energy</strong> <strong>Perspectives</strong>: <strong>Solar</strong> electricity<br />
high population and economic activities, which have greater electricity consumption.<br />
This is the essence of the so-called “Desertec” initiative (see Box: The EU-MENA<br />
connection). Long-range electricity transportation is not new, and has been most often<br />
deployed to link large reservoir hydropower dams to consuming areas. It is based on<br />
high-voltage direct-current (HVDC) technology. HVDC lines show only 3% electricity<br />
losses per 1 000 km, plus 0.6% losses in conversion at both ends, and have a smaller<br />
footprint than high-voltage alternate-current (HVAC) lines on lands. They can be deployed<br />
on sea floors at significant water depths, to link continents. HVDC lines can also be<br />
superimposed over an existing grid to increase interconnection capabilities; this is often<br />
referred to as super-grid.<br />
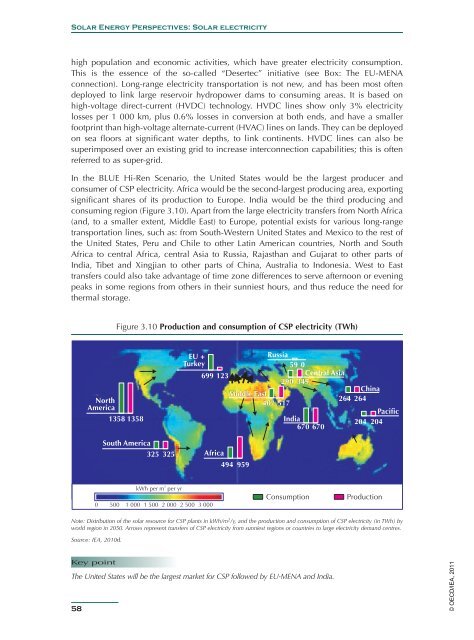
In the BLUE Hi-Ren Scenario, the United States would be the largest producer and<br />
consumer of CSP electricity. Africa would be the second-largest producing area, exporting<br />
significant shares of its production to Europe. India would be the third producing and<br />
consuming region (Figure 3.10). Apart from the large electricity transfers from North Africa<br />
(and, to a smaller extent, Middle East) to Europe, potential exists for various long-range<br />
transportation lines, such as: from South-Western United States and Mexico to the rest of<br />
the United States, Peru and Chile to other Latin American countries, North and South<br />
Africa to central Africa, central Asia to Russia, Rajasthan and Gujarat to other parts of<br />
India, Tibet and Xingjian to other parts of China, Australia to Indonesia. West to East<br />
transfers could also take advantage of time zone differences to serve afternoon or evening<br />
peaks in some regions from others in their sunniest hours, and thus reduce the need for<br />
thermal storage.<br />
Figure 3.10 Production and consumption of CSP electricity (TWh)<br />
North<br />
America<br />
1358<br />
1358<br />
EU +<br />
Turkey<br />
699<br />
Russia<br />
59 0<br />
123<br />
Central Asia<br />
290 349<br />
China<br />
Middle East<br />
264 264<br />
407 517<br />
Pacific<br />
India<br />
204 204<br />
670 670<br />
South America<br />
325 325<br />
Africa<br />
494<br />
959<br />
2<br />
kWh per m per yr<br />
0 500 1 000 1 500 2 000 2 500 3 000<br />
Consumption<br />
Production<br />
Note: Distribution of the solar resource for CSP plants in kWh/m 2 /y, and the production and consumption of CSP electricity (in TWh) by<br />
world region in 2050. Arrows represent transfers of CSP electricity from sunniest regions or countries to large electricity demand centres.<br />
Source: <strong>IEA</strong>, 2010d.<br />
Key point<br />
The United States will be the largest market for CSP followed by EU-MENA and India.<br />
58<br />
© OECD/<strong>IEA</strong>, 2011


