

Solar Energy Perspectives - IEA
Solar Energy Perspectives - IEA
Solar Energy Perspectives - IEA

Create successful ePaper yourself
Turn your PDF publications into a flip-book with our unique Google optimized e-Paper software.
Chapter 3: <strong>Solar</strong> electricity<br />
Versatile and clean electricity will thus continue to replace fossil fuels in buildings (notably<br />
through heat pumps), industry (via many applications) and transport, with a larger share of<br />
mass-transit systems and millions more electric vehicles (see Chapters 4 and 5).<br />
Demographic and economic growth and further electrification will combine to expand<br />
markets for renewable electricity in general, solar electricity in particular, including both<br />
photovoltaics (PV) and solar thermal electricity (STE) from concentrating solar power (CSP)<br />
plants. These two solar electricity technology families are presented in detail in Chapters 6<br />
to 8.<br />
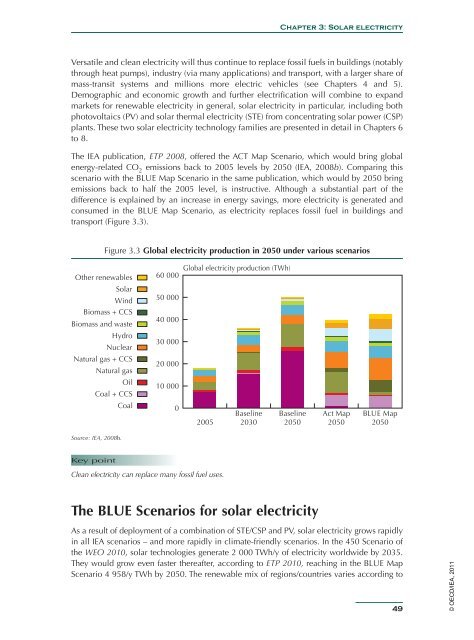
The <strong>IEA</strong> publication, ETP 2008, offered the ACT Map Scenario, which would bring global<br />
energy-related CO 2 emissions back to 2005 levels by 2050 (<strong>IEA</strong>, 2008b). Comparing this<br />
scenario with the BLUE Map Scenario in the same publication, which would by 2050 bring<br />
emissions back to half the 2005 level, is instructive. Although a substantial part of the<br />
difference is explained by an increase in energy savings, more electricity is generated and<br />
consumed in the BLUE Map Scenario, as electricity replaces fossil fuel in buildings and<br />
transport (Figure 3.3).<br />
Figure 3.3 Global electricity production in 2050 under various scenarios<br />
Other renewables<br />
60 000 Global electricity production (TWh) BLUE Map<br />
<strong>Solar</strong><br />
Wind<br />
Biomass + CCS<br />
Biomass and waste<br />
Hydro<br />
Nuclear<br />
Natural gas + CCS<br />
Natural gas<br />
Oil<br />
Coal + CCS<br />
Coal<br />
50 000<br />
40 000<br />
30 000<br />
20 000<br />
10 000<br />
0<br />
2005<br />
Baseline<br />
2030<br />
Baseline<br />
2050<br />
Act Map<br />
2050<br />
2050<br />
Source: <strong>IEA</strong>, 2008b.<br />
Key point<br />
Clean electricity can replace many fossil fuel uses.<br />
The BLUE Scenarios for solar electricity<br />
As a result of deployment of a combination of STE/CSP and PV, solar electricity grows rapidly<br />
in all <strong>IEA</strong> scenarios – and more rapidly in climate-friendly scenarios. In the 450 Scenario of<br />
the WEO 2010, solar technologies generate 2 000 TWh/y of electricity worldwide by 2035.<br />
They would grow even faster thereafter, according to ETP 2010, reaching in the BLUE Map<br />
Scenario 4 958/y TWh by 2050. The renewable mix of regions/countries varies according to<br />
49<br />
© OECD/<strong>IEA</strong>, 2011


