

Solar Energy Perspectives - IEA
Solar Energy Perspectives - IEA
Solar Energy Perspectives - IEA

Create successful ePaper yourself
Turn your PDF publications into a flip-book with our unique Google optimized e-Paper software.
<strong>Solar</strong> <strong>Energy</strong> <strong>Perspectives</strong>: <strong>Solar</strong> electricity<br />
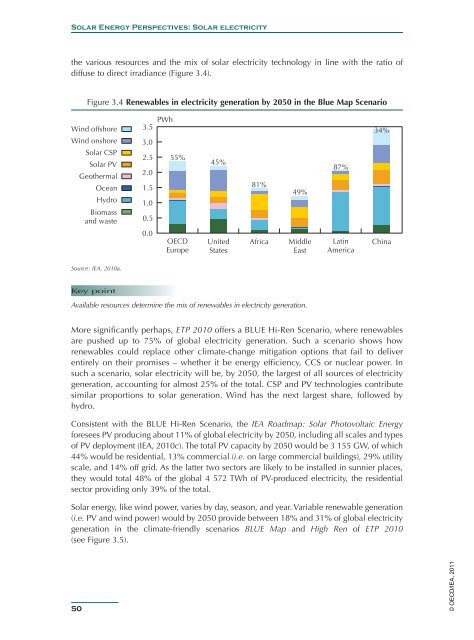
the various resources and the mix of solar electricity technology in line with the ratio of<br />
diffuse to direct irradiance (Figure 3.4).<br />
Figure 3.4 Renewables in electricity generation by 2050 in the Blue Map Scenario<br />
Wind offshore<br />
Wind onshore<br />
<strong>Solar</strong> CSP<br />
<strong>Solar</strong> PV<br />
Geothermal<br />
Ocean<br />
Hydro<br />
Biomass<br />
and waste<br />
3.5<br />
3.0<br />
2.5<br />
2.0<br />
1.5<br />
1.0<br />
0.5<br />
PWh<br />
55%<br />
45%<br />
81%<br />
49%<br />
87%<br />
34%<br />
0.0<br />
OECD<br />
Europe<br />
United<br />
States<br />
Africa<br />
Middle<br />
East<br />
Latin<br />
America<br />
China<br />
Source: <strong>IEA</strong>, 2010a.<br />
Key point<br />
Available resources determine the mix of renewables in electricity generation.<br />
More significantly perhaps, ETP 2010 offers a BLUE Hi-Ren Scenario, where renewables<br />
are pushed up to 75% of global electricity generation. Such a scenario shows how<br />
renewables could replace other climate-change mitigation options that fail to deliver<br />
entirely on their promises – whether it be energy efficiency, CCS or nuclear power. In<br />
such a scenario, solar electricity will be, by 2050, the largest of all sources of electricity<br />
generation, accounting for almost 25% of the total. CSP and PV technologies contribute<br />
similar proportions to solar generation. Wind has the next largest share, followed by<br />
hydro.<br />
Consistent with the BLUE Hi-Ren Scenario, the <strong>IEA</strong> Roadmap: <strong>Solar</strong> Photovoltaic <strong>Energy</strong><br />
foresees PV producing about 11% of global electricity by 2050, including all scales and types<br />
of PV deployment (<strong>IEA</strong>, 2010c). The total PV capacity by 2050 would be 3 155 GW, of which<br />
44% would be residential, 13% commercial (i.e. on large commercial buildings), 29% utility<br />
scale, and 14% off grid. As the latter two sectors are likely to be installed in sunnier places,<br />
they would total 48% of the global 4 572 TWh of PV-produced electricity, the residential<br />
sector providing only 39% of the total.<br />
<strong>Solar</strong> energy, like wind power, varies by day, season, and year. Variable renewable generation<br />
(i.e. PV and wind power) would by 2050 provide between 18% and 31% of global electricity<br />
generation in the climate-friendly scenarios BLUE Map and High Ren of ETP 2010<br />
(see Figure 3.5).<br />
50<br />
© OECD/<strong>IEA</strong>, 2011


