- Page 1 and 2:
Renewable Energy Renewable TECHNOLO
- Page 3 and 4:
Renewable Energy Technologies Solar
- Page 5 and 6:
INTERNATIONAL ENERGY AGENCY The Int
- Page 7 and 8:
Foreword Foreword Solar energy tech
- Page 9 and 10:
Acknowledgements Acknowledgements T
- Page 11 and 12:
Table of contents Table of Contents
- Page 13 and 14:
Table of contents Chapter 7 Solar h
- Page 15 and 16:
Table of contents Chapter 3 Chapter
- Page 17 and 18:
Table of contents Chapter 4 Figure
- Page 19 and 20:
Table of contents Figure 10.4 • N
- Page 21 and 22:
Executive Summary Executive Summary
- Page 23 and 24:
Executive Summary A possible vision
- Page 25 and 26:
Chapter 1: Rationale for harnessing
- Page 27 and 28:
Chapter 1: Rationale for harnessing
- Page 29 and 30:
Chapter 1: Rationale for harnessing
- Page 31 and 32:
PART A MARKETS AND OUTLOOK Chapter
- Page 33 and 34:
Chapter 2: The solar resource and i
- Page 35 and 36:
Chapter 2: The solar resource and i
- Page 37 and 38:
Chapter 2: The solar resource and i
- Page 39 and 40:
Chapter 2: The solar resource and i
- Page 41 and 42:
Chapter 2: The solar resource and i
- Page 43 and 44:
Chapter 2: The solar resource and i
- Page 45 and 46:
Chapter 2: The solar resource and i
- Page 47 and 48:
Chapter 2: The solar resource and i
- Page 49 and 50:
Chapter 3: Solar electricity Chapte
- Page 51 and 52:
Chapter 3: Solar electricity Versat
- Page 53 and 54:
Chapter 3: Solar electricity Figure
- Page 55 and 56:
Chapter 3: Solar electricity Figure
- Page 57 and 58:
Chapter 3: Solar electricity to a t
- Page 59 and 60:
Chapter 3: Solar electricity New in
- Page 61 and 62:
Chapter 3: Solar electricity Variou
- Page 63 and 64:
Chapter 3: Solar electricity as fro
- Page 65 and 66:
Chapter 3: Solar electricity peak t
- Page 67 and 68:
Chapter 3: Solar electricity Kenya
- Page 69 and 70:
Chapter 3: Solar electricity • Ad
- Page 71 and 72:
Chapter 4: Buildings Chapter 4 Buil
- Page 73 and 74:
Chapter 4: Buildings South Africa,
- Page 75 and 76:
Chapter 4: Buildings Figure 4.3 Bui
- Page 77 and 78:
Chapter 4: Buildings Défense near
- Page 79 and 80:
Chapter 4: Buildings larger the col
- Page 81 and 82:
Chapter 4: Buildings Pumps variant,
- Page 83 and 84:
Chapter 4: Buildings radiators or h
- Page 85 and 86:
Chapter 4: Buildings Most widesprea
- Page 87 and 88:
Chapter 4: Buildings Photo 4.5 Mans
- Page 89 and 90:
Chapter 4: Buildings the overall po
- Page 91 and 92:
Chapter 4: Buildings area is limite
- Page 93 and 94:
Chapter 4: Buildings Figure 4.11 An
- Page 95 and 96:
Chapter 5: Industry and transport C
- Page 97 and 98:
Chapter 5: Industry and transport c
- Page 99 and 100:
Chapter 5: Industry and transport i
- Page 101 and 102:
Chapter 5: Industry and transport a
- Page 103 and 104:
Chapter 5: Industry and transport i
- Page 105 and 106:
Chapter 5: Industry and transport T
- Page 107 and 108:
Chapter 5: Industry and transport h
- Page 109 and 110:
Chapter 5: Industry and transport t
- Page 111 and 112:
PART B TECHNOLOGIES Chapter 6 Solar
- Page 113 and 114:
Chapter 6: Solar photovoltaics Chap
- Page 115 and 116:
Chapter 6: Solar photovoltaics Figu
- Page 117 and 118:
Chapter 6: Solar photovoltaics of t
- Page 119 and 120:
Chapter 6: Solar photovoltaics or a
- Page 121 and 122:
Chapter 6: Solar photovoltaics Anot
- Page 123 and 124:
Chapter 6: Solar photovoltaics sout
- Page 125 and 126:
Chapter 7: Solar heat Chapter 7 Sol
- Page 127 and 128:
Chapter 7: Solar heat incoming radi
- Page 129 and 130:
Chapter 7: Solar heat Evacuated tub
- Page 131 and 132:
Chapter 7: Solar heat Photo 7.2 Che
- Page 133 and 134:
Chapter 7: Solar heat with the temp
- Page 135 and 136:
Chapter 7: Solar heat Photo 7.6 Pos
- Page 137 and 138:
Chapter 7: Solar heat Figure 7.8 Sc
- Page 139 and 140:
Chapter 7: Solar heat Figure 7.10 B
- Page 141 and 142:
Chapter 7: Solar heat inert materia
- Page 143 and 144:
Chapter 8: Solar thermal electricit
- Page 145 and 146:
Chapter 8: Solar thermal electricit
- Page 147 and 148:
Chapter 8: Solar thermal electricit
- Page 149 and 150:
Chapter 8: Solar thermal electricit
- Page 151 and 152:
Chapter 8: Solar thermal electricit
- Page 153 and 154:
Chapter 8: Solar thermal electricit
- Page 155 and 156:
Chapter 8: Solar thermal electricit
- Page 157 and 158:
Chapter 8: Solar thermal electricit
- Page 159 and 160:
Chapter 8: Solar thermal electricit
- Page 161 and 162: Chapter 8: Solar thermal electricit
- Page 163 and 164: Chapter 9: Solar fuels Chapter 9 So
- Page 165 and 166: Chapter 9: Solar fuels “Solar fue
- Page 167 and 168: Chapter 9: Solar fuels in line-focu
- Page 169 and 170: Chapter 9: Solar fuels back to wate
- Page 171 and 172: Chapter 9: Solar fuels Solar gasifi
- Page 173 and 174: PART C THE WAY FORWARD Chapter 10 P
- Page 175 and 176: Chapter 10: Policies Chapter 10 Pol
- Page 177 and 178: Chapter 10: Policies distinguish pe
- Page 179 and 180: Chapter 10: Policies Photo 10.1 Chi
- Page 181 and 182: Chapter 10: Policies In Morocco, se
- Page 183 and 184: Chapter 10: Policies and linked to
- Page 185 and 186: Chapter 10: Policies ambition of th
- Page 187 and 188: Chapter 10: Policies Figure 10.6 Sc
- Page 189 and 190: Chapter 10: Policies and can hardly
- Page 191 and 192: Chapter 10: Policies fossil-fuel pl
- Page 193 and 194: Chapter 10: Policies It would make
- Page 195 and 196: Chapter 10: Policies In the retail
- Page 197 and 198: Chapter 11: Testing the limits Chap
- Page 199 and 200: Chapter 11: Testing the limits grow
- Page 201 and 202: Chapter 11: Testing the limits betw
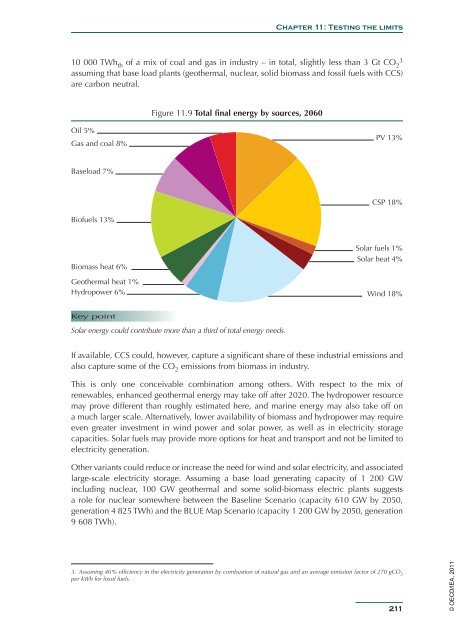
- Page 203 and 204: Chapter 11: Testing the limits Figu
- Page 205 and 206: Chapter 11: Testing the limits The
- Page 207 and 208: Chapter 11: Testing the limits esti
- Page 209 and 210: Chapter 11: Testing the limits Phot
- Page 211: Water availability is unlikely to b
- Page 215 and 216: Chapter 11: Testing the limits tran
- Page 217 and 218: Chapter 12: Conclusions and recomme
- Page 219 and 220: Chapter 12: Conclusions and recomme
- Page 221 and 222: Annex A Annex A Definitions, abbrev
- Page 223 and 224: Annex A REC RPS SACP sc-Si SEI SEII
- Page 225 and 226: Annex B Annex B References A.T. Kea
- Page 227 and 228: Annex B Greenpeace International, S
- Page 229 and 230: Annex B Malbranche, Ph. et C. Phili
- Page 233: IEA Publications, 9, rue de la Féd


