

Solar Energy Perspectives - IEA
Solar Energy Perspectives - IEA
Solar Energy Perspectives - IEA

You also want an ePaper? Increase the reach of your titles
YUMPU automatically turns print PDFs into web optimized ePapers that Google loves.
Chapter 2: The solar resource and its possible uses<br />
Figure 2.5 shows that there are days where the polar regions receive higher irradiance than<br />
all other places on earth, with about 13.5 kWh/m 2 /day at the December solstice for the South<br />
Pole and 12.6 kWh/m 2 /day at the June solstice for the North Pole, versus about 10 kWh/m 2 /day<br />
at the equator. This gap is probably accentuated, not diminished, by differences in the<br />
transparency of the atmosphere in both places. Poles are the sunniest places on earth, but<br />
only for a few days per year because summer days within the polar circles last 24 hours,<br />
against only 12 hours at the equator. 3<br />
However, this basic model is complicated by the atmosphere, and its content in water vapour<br />
and particles, which also vary over time and place. Clouds bar almost all direct beam radiation.<br />
The composition of the atmosphere has two main implications for availability of the solar energy.<br />
First, the cosine effect is compounded by the greater distance the sun’s rays must travel through<br />
the earth’s atmosphere to reach the earth’s surface when the apparent sun is lower in the sky –<br />
twice as much when the sun’s direction forms a 60° angle with the direction of the zenith. This<br />
is termed an “air mass” value of 2, versus a value of 1 when the sun is exactly overhead.<br />
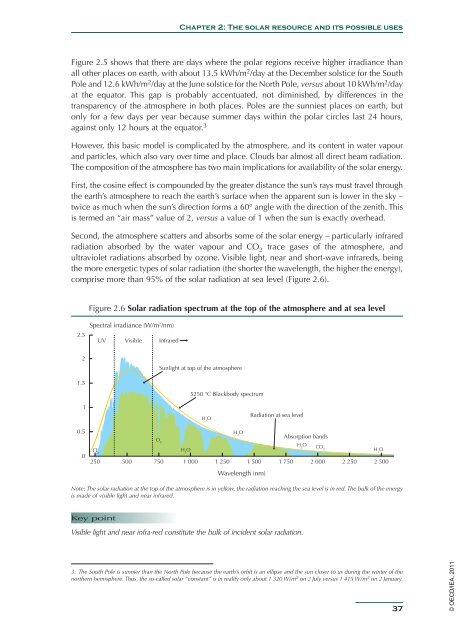
Second, the atmosphere scatters and absorbs some of the solar energy – particularly infrared<br />
radiation absorbed by the water vapour and CO 2<br />
trace gases of the atmosphere, and<br />
ultraviolet radiations absorbed by ozone. Visible light, near and short-wave infrareds, being<br />
the more energetic types of solar radiation (the shorter the wavelength, the higher the energy),<br />
comprise more than 95% of the solar radiation at sea level (Figure 2.6).<br />
Figure 2.6 <strong>Solar</strong> radiation spectrum at the top of the atmosphere and at sea level<br />
2.5<br />
Spectral irradiance (W/m 2 /nm)<br />
UV Visible Infrared<br />
2<br />
Sunlight at top of the atmosphere<br />
1.5<br />
5250 °C Blackbody spectrum<br />
1<br />
H 2<br />
O<br />
Radiation at sea level<br />
0.5<br />
O 2<br />
H 2<br />
O<br />
Absorption bands<br />
0<br />
O 3<br />
H 2<br />
O<br />
H 2<br />
O CO 2<br />
250 500 750 1 000 1 250 1 500 1 750 2 000 2 250<br />
Wavelength (nm)<br />
H 2<br />
O<br />
2 500<br />
Note: The solar radiation at the top of the atmosphere is in yellow, Figure the 2.6 radiation reaching the sea level is in red. The bulk of the energy<br />
is made of visible light and near infrared.<br />
Key point<br />
Visible light and near infra-red constitute the bulk of incident solar radiation.<br />
3. The South Pole is sunnier than the North Pole because the earth’s orbit is an ellipse and the sun closer to us during the winter of the<br />
northern hemisphere. Thus, the so-called solar “constant” is in reality only about 1 320 W/m 2 on 2 July versus 1 415 W/m 2 on 2 January.<br />
37<br />
© OECD/<strong>IEA</strong>, 2011


