

Solar Energy Perspectives - IEA
Solar Energy Perspectives - IEA
Solar Energy Perspectives - IEA

Create successful ePaper yourself
Turn your PDF publications into a flip-book with our unique Google optimized e-Paper software.
Chapter 10: Policies<br />
distinguish perceptions from realities. The gap between the true cost of support (the subsidy<br />
part) and the amount of investment increases at each doubling. The cost of PV support will<br />
peak and then decrease. It disappears after the break-even point is reached. A similar<br />
reasoning would apply to solar thermal electricity.<br />
Ignoring discount (interest) rates, the calculation does not depend on any particular agenda.<br />
Speeding or slowing the diffusion of PV does not modify the bill. Optimising the deployment<br />
agenda would require introducing discounting and selecting hypotheses on the likely<br />
evolution of market electricity prices, competing technologies and environmental benefits,<br />
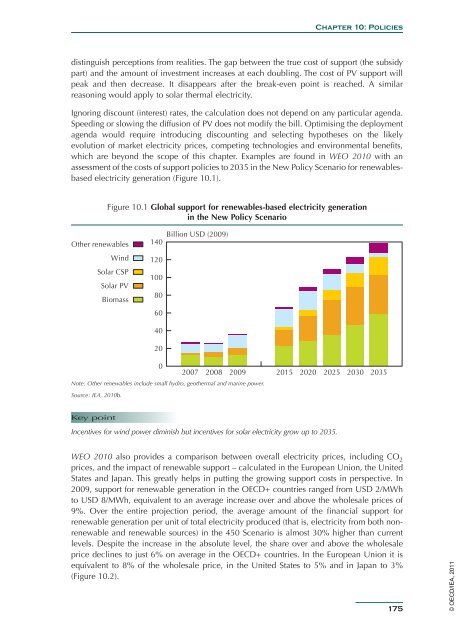
which are beyond the scope of this chapter. Examples are found in WEO 2010 with an<br />
assessment of the costs of support policies to 2035 in the New Policy Scenario for renewablesbased<br />
electricity generation (Figure 10.1).<br />
Figure 10.1 Global support for renewables-based electricity generation<br />
in the New Policy Scenario<br />
Other renewables<br />
Wind<br />
<strong>Solar</strong> CSP<br />
<strong>Solar</strong> PV<br />
Biomass<br />
140<br />
120<br />
100<br />
80<br />
60<br />
40<br />
20<br />
Billion USD (2009)<br />
0<br />
2007 2008 2009 2015 2020 2025 2030 2035<br />
Note: Other renewables include small hydro, geothermal and marine power.<br />
Source: <strong>IEA</strong>, 2010b.<br />
Key point<br />
Incentives for wind power diminish but incentives for solar electricity grow up to 2035.<br />
WEO 2010 also provides a comparison between overall electricity prices, including CO 2<br />
prices, and the impact of renewable support – calculated in the European Union, the United<br />
States and Japan. This greatly helps in putting the growing support costs in perspective. In<br />
2009, support for renewable generation in the OECD+ countries ranged from USD 2/MWh<br />
to USD 8/MWh, equivalent to an average increase over and above the wholesale prices of<br />
9%. Over the entire projection period, the average amount of the financial support for<br />
renewable generation per unit of total electricity produced (that is, electricity from both nonrenewable<br />
and renewable sources) in the 450 Scenario is almost 30% higher than current<br />
levels. Despite the increase in the absolute level, the share over and above the wholesale<br />
price declines to just 6% on average in the OECD+ countries. In the European Union it is<br />
equivalent to 8% of the wholesale price, in the United States to 5% and in Japan to 3%<br />
(Figure 10.2).<br />
175<br />
© OECD/<strong>IEA</strong>, 2011


