

Solar Energy Perspectives - IEA
Solar Energy Perspectives - IEA
Solar Energy Perspectives - IEA

Create successful ePaper yourself
Turn your PDF publications into a flip-book with our unique Google optimized e-Paper software.
Chapter 11: Testing the limits<br />
estimated from traffic and road-use data. Usually, peak late-afternoon traffic occurs during the<br />
peak electricity demand period (from 3 pm to 6 pm). According to United States statistics, even<br />
in that period 92% of vehicles are parked and potentially available to the grid (Inage, 2010).<br />
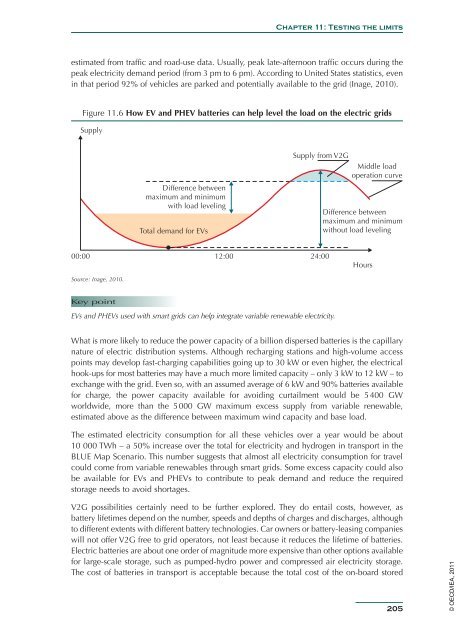
Figure 11.6 How EV and PHEV batteries can help level the load on the electric grids<br />
Supply<br />
Difference between<br />
maximum and minimum<br />
with load leveling<br />
Total demand for EVs<br />
Supply from V2G<br />
Middle load<br />
operation curve<br />
Difference between<br />
maximum and minimum<br />
without load leveling<br />
00:00 12:00 24:00<br />
Hours<br />
Source: Inage, 2010.<br />
Key point<br />
EVs and PHEVs used with smart grids can help integrate variable renewable electricity.<br />
What is more likely to reduce the power capacity of a billion dispersed batteries is the capillary<br />
nature of electric distribution systems. Although recharging stations and high-volume access<br />
points may develop fast-charging capabilities going up to 30 kW or even higher, the electrical<br />
hook-ups for most batteries may have a much more limited capacity – only 3 kW to 12 kW – to<br />
exchange with the grid. Even so, with an assumed average of 6 kW and 90% batteries available<br />
for charge, the power capacity available for avoiding curtailment would be 5 400 GW<br />
worldwide, more than the 5 000 GW maximum excess supply from variable renewable,<br />
estimated above as the difference between maximum wind capacity and base load.<br />
The estimated electricity consumption for all these vehicles over a year would be about<br />
10 000 TWh – a 50% increase over the total for electricity and hydrogen in transport in the<br />
BLUE Map Scenario. This number suggests that almost all electricity consumption for travel<br />
could come from variable renewables through smart grids. Some excess capacity could also<br />
be available for EVs and PHEVs to contribute to peak demand and reduce the required<br />
storage needs to avoid shortages.<br />
V2G possibilities certainly need to be further explored. They do entail costs, however, as<br />
battery lifetimes depend on the number, speeds and depths of charges and discharges, although<br />
to different extents with different battery technologies. Car owners or battery-leasing companies<br />
will not offer V2G free to grid operators, not least because it reduces the lifetime of batteries.<br />
Electric batteries are about one order of magnitude more expensive than other options available<br />
for large-scale storage, such as pumped-hydro power and compressed air electricity storage.<br />
The cost of batteries in transport is acceptable because the total cost of the on-board stored<br />
205<br />
© OECD/<strong>IEA</strong>, 2011


