Child Poverty in Mozambique. A Situation and Trend ... - Unicef
Child Poverty in Mozambique. A Situation and Trend ... - Unicef
Child Poverty in Mozambique. A Situation and Trend ... - Unicef

Create successful ePaper yourself
Turn your PDF publications into a flip-book with our unique Google optimized e-Paper software.
100<br />
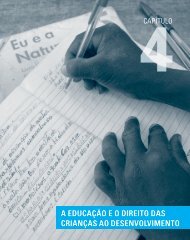
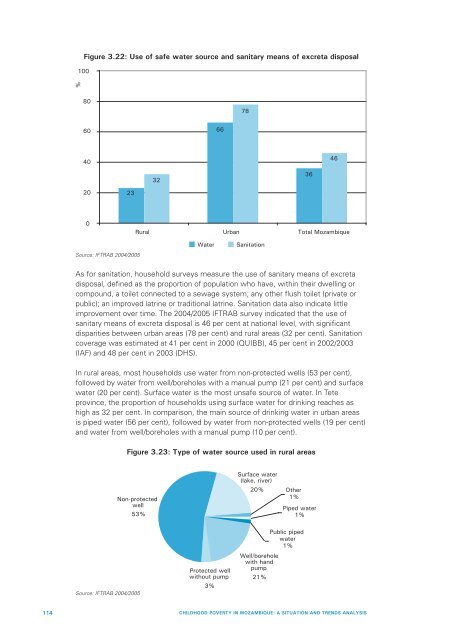
Figure 3.22: Use of safe water source <strong>and</strong> sanitary means of excreta disposal<br />
%<br />
80<br />
78<br />
60<br />
66<br />
40<br />
46<br />
32<br />
36<br />
20<br />
23<br />
0<br />
Rural Urban Total <strong>Mozambique</strong><br />
Water<br />
Sanitation<br />
Source: IFTRAB 2004/2005<br />
As for sanitation, household surveys measure the use of sanitary means of excreta<br />
disposal, def<strong>in</strong>ed as the proportion of population who have, with<strong>in</strong> their dwell<strong>in</strong>g or<br />
compound, a toilet connected to a sewage system; any other flush toilet (private or<br />
public); an improved latr<strong>in</strong>e or traditional latr<strong>in</strong>e. Sanitation data also <strong>in</strong>dicate little<br />
improvement over time. The 2004/2005 IFTRAB survey <strong>in</strong>dicated that the use of<br />
sanitary means of excreta disposal is 46 per cent at national level, with significant<br />
disparities between urban areas (78 per cent) <strong>and</strong> rural areas (32 per cent). Sanitation<br />
coverage was estimated at 41 per cent <strong>in</strong> 2000 (QUIBB), 45 per cent <strong>in</strong> 2002/2003<br />
(IAF) <strong>and</strong> 48 per cent <strong>in</strong> 2003 (DHS).<br />
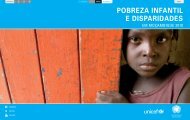
In rural areas, most households use water from non-protected wells (53 per cent),<br />
followed by water from well/boreholes with a manual pump (21 per cent) <strong>and</strong> surface<br />
water (20 per cent). Surface water is the most unsafe source of water. In Tete<br />
prov<strong>in</strong>ce, the proportion of households us<strong>in</strong>g surface water for dr<strong>in</strong>k<strong>in</strong>g reaches as<br />
high as 32 per cent. In comparison, the ma<strong>in</strong> source of dr<strong>in</strong>k<strong>in</strong>g water <strong>in</strong> urban areas<br />
is piped water (56 per cent), followed by water from non-protected wells (19 per cent)<br />
<strong>and</strong> water from well/boreholes with a manual pump (10 per cent).<br />
Figure 3.23: Type of water source used <strong>in</strong> rural areas<br />
Non-protected<br />
well<br />
53%<br />
Surface water<br />
(lake, river)<br />
20%<br />
Other<br />
1%<br />
Piped water<br />
1%<br />
Source: IFTRAB 2004/2005<br />
Protected well<br />
without pump<br />
3%<br />
Well/borehole<br />
with h<strong>and</strong><br />
pump<br />
21%<br />
Public piped<br />
water<br />
1%<br />
114 CHILDHOOD POVERTY IN MOZAMBIQUE: A SITUATION AND TRENDS ANALYSIS