Child Poverty in Mozambique. A Situation and Trend ... - Unicef
Child Poverty in Mozambique. A Situation and Trend ... - Unicef
Child Poverty in Mozambique. A Situation and Trend ... - Unicef

You also want an ePaper? Increase the reach of your titles
YUMPU automatically turns print PDFs into web optimized ePapers that Google loves.
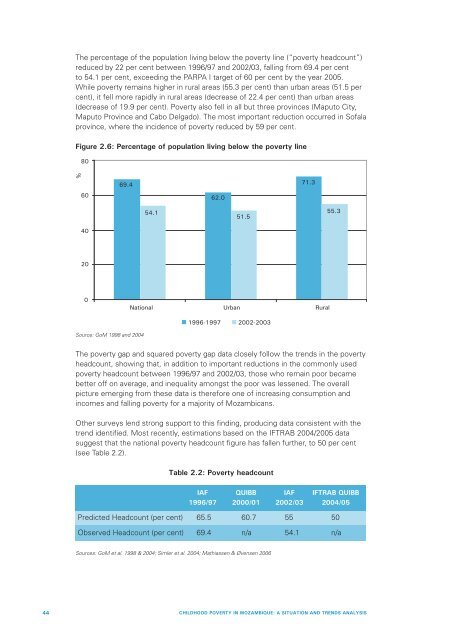
The percentage of the population liv<strong>in</strong>g below the poverty l<strong>in</strong>e (“poverty headcount”)<br />
reduced by 22 per cent between 1996/97 <strong>and</strong> 2002/03, fall<strong>in</strong>g from 69.4 per cent<br />
to 54.1 per cent, exceed<strong>in</strong>g the PARPA I target of 60 per cent by the year 2005.<br />
While poverty rema<strong>in</strong>s higher <strong>in</strong> rural areas (55.3 per cent) than urban areas (51.5 per<br />
cent), it fell more rapidly <strong>in</strong> rural areas (decrease of 22.4 per cent) than urban areas<br />
(decrease of 19.9 per cent). <strong>Poverty</strong> also fell <strong>in</strong> all but three prov<strong>in</strong>ces (Maputo City,<br />
Maputo Prov<strong>in</strong>ce <strong>and</strong> Cabo Delgado). The most important reduction occurred <strong>in</strong> Sofala<br />
prov<strong>in</strong>ce, where the <strong>in</strong>cidence of poverty reduced by 59 per cent.<br />
Figure 2.6: Percentage of population liv<strong>in</strong>g below the poverty l<strong>in</strong>e<br />
80<br />
%<br />
60<br />
69.4<br />
62.0<br />
71.3<br />
54.1<br />
51.5<br />
55.3<br />
40<br />
20<br />
0<br />
National Urban Rural<br />
1996-1997 2002-2003<br />
Source: GoM 1998 <strong>and</strong> 2004<br />
The poverty gap <strong>and</strong> squared poverty gap data closely follow the trends <strong>in</strong> the poverty<br />
headcount, show<strong>in</strong>g that, <strong>in</strong> addition to important reductions <strong>in</strong> the commonly used<br />
poverty headcount between 1996/97 <strong>and</strong> 2002/03, those who rema<strong>in</strong> poor became<br />
better off on average, <strong>and</strong> <strong>in</strong>equality amongst the poor was lessened. The overall<br />
picture emerg<strong>in</strong>g from these data is therefore one of <strong>in</strong>creas<strong>in</strong>g consumption <strong>and</strong><br />
<strong>in</strong>comes <strong>and</strong> fall<strong>in</strong>g poverty for a majority of Mozambicans.<br />
Other surveys lend strong support to this f<strong>in</strong>d<strong>in</strong>g, produc<strong>in</strong>g data consistent with the<br />
trend identified. Most recently, estimations based on the IFTRAB 2004/2005 data<br />
suggest that the national poverty headcount figure has fallen further, to 50 per cent<br />
(see Table 2.2).<br />
Table 2.2: <strong>Poverty</strong> headcount<br />
IAF QUIBB IAF IFTRAB QUIBB<br />
1996/97 2000/01 2002/03 2004/05<br />
Predicted Headcount (per cent) 65.5 60.7 55 50<br />
Observed Headcount (per cent) 69.4 n/a 54.1 n/a<br />
Sources: GoM et al. 1998 & 2004; Simler et al. 2004; Mathiassen & Øvensen 2006<br />
44 CHILDHOOD POVERTY IN MOZAMBIQUE: A SITUATION AND TRENDS ANALYSIS