Child Poverty in Mozambique. A Situation and Trend ... - Unicef
Child Poverty in Mozambique. A Situation and Trend ... - Unicef
Child Poverty in Mozambique. A Situation and Trend ... - Unicef

Create successful ePaper yourself
Turn your PDF publications into a flip-book with our unique Google optimized e-Paper software.
The public budget is the Government’s primary tool for allocat<strong>in</strong>g resources for<br />
childhood poverty reduction. With<strong>in</strong> sectors, the equitable allocation of resources<br />
across prov<strong>in</strong>ces <strong>and</strong> programmes is also fundamental for reduc<strong>in</strong>g prevail<strong>in</strong>g<br />
disparities. Accord<strong>in</strong>g to official figures conta<strong>in</strong>ed <strong>in</strong> the Government accounts (CGE),<br />
total expenditure averaged around 27 per cent of GDP over the period 2000 to 2005<br />
<strong>and</strong> was f<strong>in</strong>anced by domestic revenues <strong>and</strong> aid <strong>in</strong>flows <strong>in</strong> approximately equal<br />
proportions. The Government is thus heavily reliant on aid flows.<br />
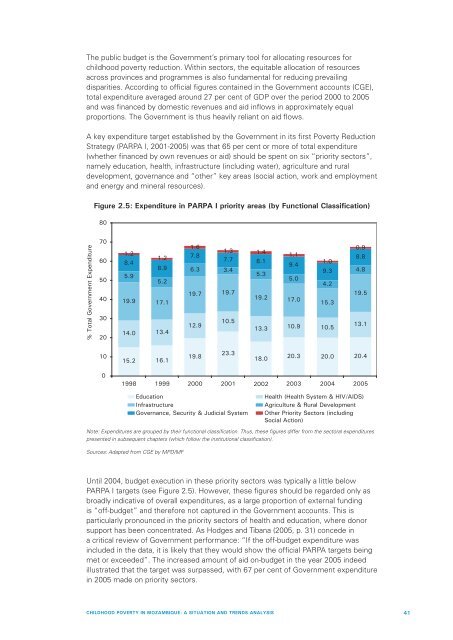
A key expenditure target established by the Government <strong>in</strong> its first <strong>Poverty</strong> Reduction<br />
Strategy (PARPA I, 2001-2005) was that 65 per cent or more of total expenditure<br />
(whether f<strong>in</strong>anced by own revenues or aid) should be spent on six “priority sectors”,<br />
namely education, health, <strong>in</strong>frastructure (<strong>in</strong>clud<strong>in</strong>g water), agriculture <strong>and</strong> rural<br />
development, governance <strong>and</strong> “other” key areas (social action, work <strong>and</strong> employment<br />
<strong>and</strong> energy <strong>and</strong> m<strong>in</strong>eral resources).<br />
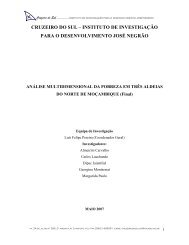
Figure 2.5: Expenditure <strong>in</strong> PARPA I priority areas (by Functional Classification)<br />
80<br />
% Total Government Expenditure<br />
70<br />
.<br />
60<br />
50<br />
40<br />
30<br />
20<br />
1.2<br />
1.2<br />
8.4<br />
8.9<br />
5.9<br />
5.2<br />
19.9 17.1<br />
14.0 13.4<br />
1.6<br />
1.3 1.4<br />
7.8<br />
1.1<br />
7.7 8.1<br />
1.0<br />
9.4<br />
6.3 3.4<br />
9.3<br />
5.3<br />
5.0<br />
4.2<br />
19.7 19.7<br />
19.2 17.0<br />
15.3<br />
10.5<br />
12.9<br />
13.3 10.9 10.5<br />
0.9<br />
8.8<br />
4.8<br />
19.5<br />
13.1<br />
10<br />
15.2 16.1<br />
19.8<br />
23.3<br />
18.0<br />
20.3 20.0 20.4<br />
0<br />
1998 1999 2000 2001 2002 2003 2004 2005<br />
Education<br />
Infrastructure<br />
Governance, Security & Judicial System<br />
Health (Health System & HIV/AIDS)<br />
Agriculture & Rural Development<br />
Other Priority Sectors (<strong>in</strong>clud<strong>in</strong>g<br />
Social Action)<br />
Note: Expenditures are grouped by their functional classification. Thus, these figures differ from the sectoral expenditures<br />
presented <strong>in</strong> subsequent chapters (which follow the <strong>in</strong>stitutional classification).<br />
Sources: Adapted from CGE by MPD/MF<br />
Until 2004, budget execution <strong>in</strong> these priority sectors was typically a little below<br />
PARPA I targets (see Figure 2.5). However, these figures should be regarded only as<br />
broadly <strong>in</strong>dicative of overall expenditures, as a large proportion of external fund<strong>in</strong>g<br />
is “off-budget” <strong>and</strong> therefore not captured <strong>in</strong> the Government accounts. This is<br />
particularly pronounced <strong>in</strong> the priority sectors of health <strong>and</strong> education, where donor<br />
support has been concentrated. As Hodges <strong>and</strong> Tibana (2005, p. 31) concede <strong>in</strong><br />
a critical review of Government performance: “If the off-budget expenditure was<br />
<strong>in</strong>cluded <strong>in</strong> the data, it is likely that they would show the official PARPA targets be<strong>in</strong>g<br />
met or exceeded”. The <strong>in</strong>creased amount of aid on-budget <strong>in</strong> the year 2005 <strong>in</strong>deed<br />
illustrated that the target was surpassed, with 67 per cent of Government expenditure<br />
<strong>in</strong> 2005 made on priority sectors.<br />
CHILDHOOD POVERTY IN MOZAMBIQUE: A SITUATION AND TRENDS ANALYSIS<br />
41