Child Poverty in Mozambique. A Situation and Trend ... - Unicef
Child Poverty in Mozambique. A Situation and Trend ... - Unicef
Child Poverty in Mozambique. A Situation and Trend ... - Unicef

You also want an ePaper? Increase the reach of your titles
YUMPU automatically turns print PDFs into web optimized ePapers that Google loves.
The 2005 Nutrition Survey conducted among 6-59 month-old children <strong>in</strong> 54 drought<br />
affected districts <strong>in</strong>dicated a much higher prevalence than the 2003 DHS, with 37 per<br />
cent of children experienc<strong>in</strong>g diarrhoea <strong>in</strong> the two weeks preced<strong>in</strong>g the survey. As <strong>in</strong><br />
the DHS, the prevalence of diarrhoea was highest among children aged 6-11 months,<br />
at 53 per cent, dropp<strong>in</strong>g to 20 per cent amongst children aged 48-59 months <strong>in</strong> these<br />
highest food <strong>in</strong>security districts.<br />
The higher prevalence of diarrhoea found <strong>in</strong> these districts shows the correlation<br />
between drought <strong>and</strong> diarrhoea. <strong>Child</strong>ren liv<strong>in</strong>g <strong>in</strong> drought-affected areas are much<br />
more likely to experience water-related illnesses, such as diarrhoea, due to <strong>in</strong>creased<br />
reliance on unsafe water sources when regular water sources have dried up, as well<br />
as an <strong>in</strong>creased likelihood of malnutrition, which <strong>in</strong>creases susceptibility to diarrhoeal<br />
diseases. <strong>Child</strong>ren suffer<strong>in</strong>g from malnutrition (stunt<strong>in</strong>g) showed an <strong>in</strong>creased<br />
susceptibility to water-borne illnesses, with 51 per cent of children identified as be<strong>in</strong>g<br />
malnourished experienc<strong>in</strong>g diarrhoea <strong>in</strong> the two weeks prior to the survey, compared<br />
with 37 per cent of non-malnourished children.<br />
D. Vacc<strong>in</strong>e preventable diseases <strong>and</strong> immunisation<br />
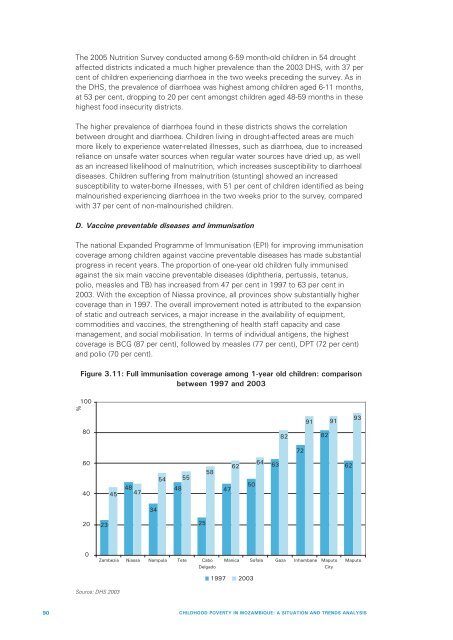
The national Exp<strong>and</strong>ed Programme of Immunisation (EPI) for improv<strong>in</strong>g immunisation<br />
coverage among children aga<strong>in</strong>st vacc<strong>in</strong>e preventable diseases has made substantial<br />
progress <strong>in</strong> recent years. The proportion of one-year old children fully immunised<br />
aga<strong>in</strong>st the six ma<strong>in</strong> vacc<strong>in</strong>e preventable diseases (diphtheria, pertussis, tetanus,<br />
polio, measles <strong>and</strong> TB) has <strong>in</strong>creased from 47 per cent <strong>in</strong> 1997 to 63 per cent <strong>in</strong><br />
2003. With the exception of Niassa prov<strong>in</strong>ce, all prov<strong>in</strong>ces show substantially higher<br />
coverage than <strong>in</strong> 1997. The overall improvement noted is attributed to the expansion<br />
of static <strong>and</strong> outreach services, a major <strong>in</strong>crease <strong>in</strong> the availability of equipment,<br />
commodities <strong>and</strong> vacc<strong>in</strong>es, the strengthen<strong>in</strong>g of health staff capacity <strong>and</strong> case<br />
management, <strong>and</strong> social mobilisation. In terms of <strong>in</strong>dividual antigens, the highest<br />
coverage is BCG (87 per cent), followed by measles (77 per cent), DPT (72 per cent)<br />
<strong>and</strong> polio (70 per cent).<br />
Figure 3.11: Full immunisation coverage among 1-year old children: comparison<br />
between 1997 <strong>and</strong> 2003<br />
100<br />
%<br />
91 91<br />
93<br />
80<br />
82<br />
82<br />
72<br />
60<br />
40<br />
48<br />
45 47<br />
54 55<br />
48<br />
58<br />
47<br />
62<br />
50<br />
64<br />
63<br />
62<br />
34<br />
20<br />
23<br />
25<br />
0<br />
Zambezia Niassa Nampula Tete Cabo<br />
Delgado<br />
Manica Sofala Gaza Inhambane Maputo<br />
City<br />
Maputo<br />
1997 2003<br />
Source: DHS 2003<br />
90 CHILDHOOD POVERTY IN MOZAMBIQUE: A SITUATION AND TRENDS ANALYSIS