Child Poverty in Mozambique. A Situation and Trend ... - Unicef
Child Poverty in Mozambique. A Situation and Trend ... - Unicef
Child Poverty in Mozambique. A Situation and Trend ... - Unicef
Create successful ePaper yourself
Turn your PDF publications into a flip-book with our unique Google optimized e-Paper software.
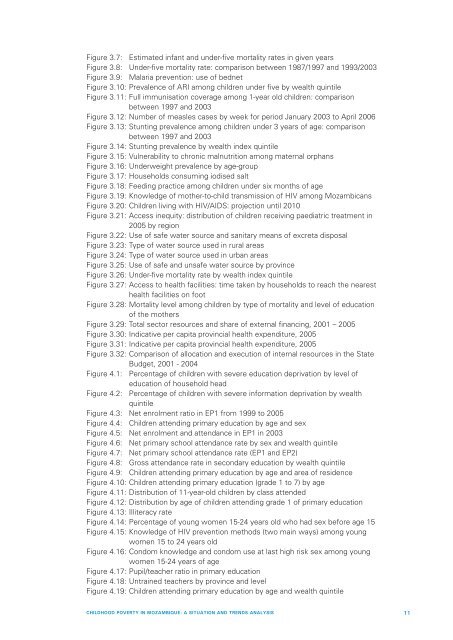
Figure 3.7: Estimated <strong>in</strong>fant <strong>and</strong> under-five mortality rates <strong>in</strong> given years<br />
Figure 3.8: Under-five mortality rate: comparison between 1987/1997 <strong>and</strong> 1993/2003<br />
Figure 3.9: Malaria prevention: use of bednet<br />
Figure 3.10: Prevalence of ARI among children under five by wealth qu<strong>in</strong>tile<br />
Figure 3.11: Full immunisation coverage among 1-year old children: comparison<br />
between 1997 <strong>and</strong> 2003<br />
Figure 3.12: Number of measles cases by week for period January 2003 to April 2006<br />
Figure 3.13: Stunt<strong>in</strong>g prevalence among children under 3 years of age: comparison<br />
between 1997 <strong>and</strong> 2003<br />
Figure 3.14: Stunt<strong>in</strong>g prevalence by wealth <strong>in</strong>dex qu<strong>in</strong>tile<br />
Figure 3.15: Vulnerability to chronic malnutrition among maternal orphans<br />
Figure 3.16: Underweight prevalence by age-group<br />
Figure 3.17: Households consum<strong>in</strong>g iodised salt<br />
Figure 3.18: Feed<strong>in</strong>g practice among children under six months of age<br />
Figure 3.19: Knowledge of mother-to-child transmission of HIV among Mozambicans<br />
Figure 3.20: <strong>Child</strong>ren liv<strong>in</strong>g with HIV/AIDS: projection until 2010<br />
Figure 3.21: Access <strong>in</strong>equity: distribution of children receiv<strong>in</strong>g paediatric treatment <strong>in</strong><br />
2005 by region<br />
Figure 3.22: Use of safe water source <strong>and</strong> sanitary means of excreta disposal<br />
Figure 3.23: Type of water source used <strong>in</strong> rural areas<br />
Figure 3.24: Type of water source used <strong>in</strong> urban areas<br />
Figure 3.25: Use of safe <strong>and</strong> unsafe water source by prov<strong>in</strong>ce<br />
Figure 3.26: Under-five mortality rate by wealth <strong>in</strong>dex qu<strong>in</strong>tile<br />
Figure 3.27: Access to health facilities: time taken by households to reach the nearest<br />
health facilities on foot<br />
Figure 3.28: Mortality level among children by type of mortality <strong>and</strong> level of education<br />
of the mothers<br />
Figure 3.29: Total sector resources <strong>and</strong> share of external f<strong>in</strong>anc<strong>in</strong>g, 2001 – 2005<br />
Figure 3.30: Indicative per capita prov<strong>in</strong>cial health expenditure, 2005<br />
Figure 3.31: Indicative per capita prov<strong>in</strong>cial health expenditure, 2005<br />
Figure 3.32: Comparison of allocation <strong>and</strong> execution of <strong>in</strong>ternal resources <strong>in</strong> the State<br />
Budget, 2001 - 2004<br />
Figure 4.1: Percentage of children with severe education deprivation by level of<br />
education of household head<br />
Figure 4.2: Percentage of children with severe <strong>in</strong>formation deprivation by wealth<br />
qu<strong>in</strong>tile<br />
Figure 4.3: Net enrolment ratio <strong>in</strong> EP1 from 1999 to 2005<br />
Figure 4.4: <strong>Child</strong>ren attend<strong>in</strong>g primary education by age <strong>and</strong> sex<br />
Figure 4.5: Net enrolment <strong>and</strong> attendance <strong>in</strong> EP1 <strong>in</strong> 2003<br />
Figure 4.6: Net primary school attendance rate by sex <strong>and</strong> wealth qu<strong>in</strong>tile<br />
Figure 4.7: Net primary school attendance rate (EP1 <strong>and</strong> EP2)<br />
Figure 4.8: Gross attendance rate <strong>in</strong> secondary education by wealth qu<strong>in</strong>tile<br />
Figure 4.9: <strong>Child</strong>ren attend<strong>in</strong>g primary education by age <strong>and</strong> area of residence<br />
Figure 4.10: <strong>Child</strong>ren attend<strong>in</strong>g primary education (grade 1 to 7) by age<br />
Figure 4.11: Distribution of 11-year-old children by class attended<br />
Figure 4.12: Distribution by age of children attend<strong>in</strong>g grade 1 of primary education<br />
Figure 4.13: Illiteracy rate<br />
Figure 4.14: Percentage of young women 15-24 years old who had sex before age 15<br />
Figure 4.15: Knowledge of HIV prevention methods (two ma<strong>in</strong> ways) among young<br />
women 15 to 24 years old<br />
Figure 4.16: Condom knowledge <strong>and</strong> condom use at last high risk sex among young<br />
women 15-24 years of age<br />
Figure 4.17: Pupil/teacher ratio <strong>in</strong> primary education<br />
Figure 4.18: Untra<strong>in</strong>ed teachers by prov<strong>in</strong>ce <strong>and</strong> level<br />
Figure 4.19: <strong>Child</strong>ren attend<strong>in</strong>g primary education by age <strong>and</strong> wealth qu<strong>in</strong>tile<br />
CHILDHOOD POVERTY IN MOZAMBIQUE: A SITUATION AND TRENDS ANALYSIS<br />
11


