Child Poverty in Mozambique. A Situation and Trend ... - Unicef
Child Poverty in Mozambique. A Situation and Trend ... - Unicef
Child Poverty in Mozambique. A Situation and Trend ... - Unicef

Create successful ePaper yourself
Turn your PDF publications into a flip-book with our unique Google optimized e-Paper software.
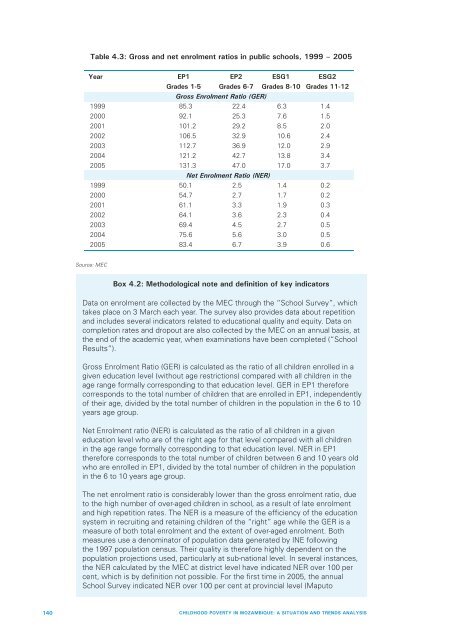
Table 4.3: Gross <strong>and</strong> net enrolment ratios <strong>in</strong> public schools, 1999 – 2005<br />
Year EP1 EP2 ESG1 ESG2<br />
Grades 1-5 Grades 6-7 Grades 8-10 Grades 11-12<br />
Gross Enrolment Ratio (GER)<br />
1999 85.3 22.4 6.3 1.4<br />
2000 92.1 25.3 7.6 1.5<br />
2001 101.2 29.2 8.5 2.0<br />
2002 106.5 32.9 10.6 2.4<br />
2003 112.7 36.9 12.0 2.9<br />
2004 121.2 42.7 13.8 3.4<br />
2005 131.3 47.0 17.0 3.7<br />
Net Enrolment Ratio (NER)<br />
1999 50.1 2.5 1.4 0.2<br />
2000 54.7 2.7 1.7 0.2<br />
2001 61.1 3.3 1.9 0.3<br />
2002 64.1 3.6 2.3 0.4<br />
2003 69.4 4.5 2.7 0.5<br />
2004 75.6 5.6 3.0 0.5<br />
2005 83.4 6.7 3.9 0.6<br />
Source: MEC<br />
Box 4.2: Methodological note <strong>and</strong> def<strong>in</strong>ition of key <strong>in</strong>dicators<br />
Data on enrolment are collected by the MEC through the “School Survey”, which<br />
takes place on 3 March each year. The survey also provides data about repetition<br />
<strong>and</strong> <strong>in</strong>cludes several <strong>in</strong>dicators related to educational quality <strong>and</strong> equity. Data on<br />
completion rates <strong>and</strong> dropout are also collected by the MEC on an annual basis, at<br />
the end of the academic year, when exam<strong>in</strong>ations have been completed (“School<br />
Results”).<br />
Gross Enrolment Ratio (GER) is calculated as the ratio of all children enrolled <strong>in</strong> a<br />
given education level (without age restrictions) compared with all children <strong>in</strong> the<br />
age range formally correspond<strong>in</strong>g to that education level. GER <strong>in</strong> EP1 therefore<br />
corresponds to the total number of children that are enrolled <strong>in</strong> EP1, <strong>in</strong>dependently<br />
of their age, divided by the total number of children <strong>in</strong> the population <strong>in</strong> the 6 to 10<br />
years age group.<br />
Net Enrolment ratio (NER) is calculated as the ratio of all children <strong>in</strong> a given<br />
education level who are of the right age for that level compared with all children<br />
<strong>in</strong> the age range formally correspond<strong>in</strong>g to that education level. NER <strong>in</strong> EP1<br />
therefore corresponds to the total number of children between 6 <strong>and</strong> 10 years old<br />
who are enrolled <strong>in</strong> EP1, divided by the total number of children <strong>in</strong> the population<br />
<strong>in</strong> the 6 to 10 years age group.<br />
The net enrolment ratio is considerably lower than the gross enrolment ratio, due<br />
to the high number of over-aged children <strong>in</strong> school, as a result of late enrolment<br />
<strong>and</strong> high repetition rates. The NER is a measure of the efficiency of the education<br />
system <strong>in</strong> recruit<strong>in</strong>g <strong>and</strong> reta<strong>in</strong><strong>in</strong>g children of the “right” age while the GER is a<br />
measure of both total enrolment <strong>and</strong> the extent of over-aged enrolment. Both<br />
measures use a denom<strong>in</strong>ator of population data generated by INE follow<strong>in</strong>g<br />
the 1997 population census. Their quality is therefore highly dependent on the<br />
population projections used, particularly at sub-national level. In several <strong>in</strong>stances,<br />
the NER calculated by the MEC at district level have <strong>in</strong>dicated NER over 100 per<br />
cent, which is by def<strong>in</strong>ition not possible. For the first time <strong>in</strong> 2005, the annual<br />
School Survey <strong>in</strong>dicated NER over 100 per cent at prov<strong>in</strong>cial level (Maputo<br />
140 CHILDHOOD POVERTY IN MOZAMBIQUE: A SITUATION AND TRENDS ANALYSIS