Child Poverty in Mozambique. A Situation and Trend ... - Unicef
Child Poverty in Mozambique. A Situation and Trend ... - Unicef
Child Poverty in Mozambique. A Situation and Trend ... - Unicef
You also want an ePaper? Increase the reach of your titles
YUMPU automatically turns print PDFs into web optimized ePapers that Google loves.
epetition <strong>and</strong> drop-out rates at nearly all grade levels from 1999 to 2004, with an<br />
accompany<strong>in</strong>g improvement <strong>in</strong> the probability of mov<strong>in</strong>g to the next grade level.<br />
However, the cont<strong>in</strong>u<strong>in</strong>g extreme gap between high enrolment <strong>and</strong> low completion<br />
rates <strong>in</strong>dicates massive <strong>in</strong>efficiencies <strong>in</strong> the education system, with wasted learn<strong>in</strong>g<br />
opportunities for children <strong>and</strong> wasted resources for poverty reduction.<br />
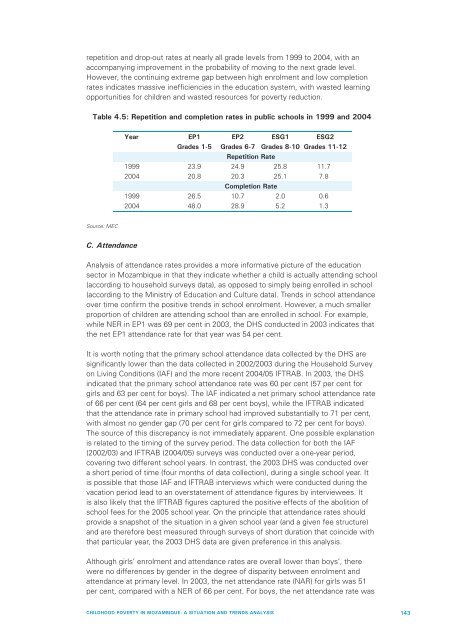
Table 4.5: Repetition <strong>and</strong> completion rates <strong>in</strong> public schools <strong>in</strong> 1999 <strong>and</strong> 2004<br />
Year EP1 EP2 ESG1 ESG2<br />
Grades 1-5 Grades 6-7 Grades 8-10 Grades 11-12<br />
Repetition Rate<br />
1999 23.9 24.9 25.8 11.7<br />
2004 20.8 20.3 25.1 7.8<br />
Completion Rate<br />
1999 26.5 10.7 2.0 0.6<br />
2004 48.0 28.9 5.2 1.3<br />
Source: MEC<br />
C. Attendance<br />
Analysis of attendance rates provides a more <strong>in</strong>formative picture of the education<br />
sector <strong>in</strong> <strong>Mozambique</strong> <strong>in</strong> that they <strong>in</strong>dicate whether a child is actually attend<strong>in</strong>g school<br />
(accord<strong>in</strong>g to household surveys data), as opposed to simply be<strong>in</strong>g enrolled <strong>in</strong> school<br />
(accord<strong>in</strong>g to the M<strong>in</strong>istry of Education <strong>and</strong> Culture data). <strong>Trend</strong>s <strong>in</strong> school attendance<br />
over time confirm the positive trends <strong>in</strong> school enrolment. However, a much smaller<br />
proportion of children are attend<strong>in</strong>g school than are enrolled <strong>in</strong> school. For example,<br />
while NER <strong>in</strong> EP1 was 69 per cent <strong>in</strong> 2003, the DHS conducted <strong>in</strong> 2003 <strong>in</strong>dicates that<br />
the net EP1 attendance rate for that year was 54 per cent.<br />
It is worth not<strong>in</strong>g that the primary school attendance data collected by the DHS are<br />
significantly lower than the data collected <strong>in</strong> 2002/2003 dur<strong>in</strong>g the Household Survey<br />
on Liv<strong>in</strong>g Conditions (IAF) <strong>and</strong> the more recent 2004/05 IFTRAB. In 2003, the DHS<br />
<strong>in</strong>dicated that the primary school attendance rate was 60 per cent (57 per cent for<br />
girls <strong>and</strong> 63 per cent for boys). The IAF <strong>in</strong>dicated a net primary school attendance rate<br />
of 66 per cent (64 per cent girls <strong>and</strong> 68 per cent boys), while the IFTRAB <strong>in</strong>dicated<br />
that the attendance rate <strong>in</strong> primary school had improved substantially to 71 per cent,<br />
with almost no gender gap (70 per cent for girls compared to 72 per cent for boys).<br />
The source of this discrepancy is not immediately apparent. One possible explanation<br />
is related to the tim<strong>in</strong>g of the survey period. The data collection for both the IAF<br />
(2002/03) <strong>and</strong> IFTRAB (2004/05) surveys was conducted over a one-year period,<br />
cover<strong>in</strong>g two different school years. In contrast, the 2003 DHS was conducted over<br />
a short period of time (four months of data collection), dur<strong>in</strong>g a s<strong>in</strong>gle school year. It<br />
is possible that those IAF <strong>and</strong> IFTRAB <strong>in</strong>terviews which were conducted dur<strong>in</strong>g the<br />
vacation period lead to an overstatement of attendance figures by <strong>in</strong>terviewees. It<br />
is also likely that the IFTRAB figures captured the positive effects of the abolition of<br />
school fees for the 2005 school year. On the pr<strong>in</strong>ciple that attendance rates should<br />
provide a snapshot of the situation <strong>in</strong> a given school year (<strong>and</strong> a given fee structure)<br />
<strong>and</strong> are therefore best measured through surveys of short duration that co<strong>in</strong>cide with<br />
that particular year, the 2003 DHS data are given preference <strong>in</strong> this analysis.<br />
Although girls’ enrolment <strong>and</strong> attendance rates are overall lower than boys’, there<br />
were no differences by gender <strong>in</strong> the degree of disparity between enrolment <strong>and</strong><br />
attendance at primary level. In 2003, the net attendance rate (NAR) for girls was 51<br />
per cent, compared with a NER of 66 per cent. For boys, the net attendance rate was<br />
CHILDHOOD POVERTY IN MOZAMBIQUE: A SITUATION AND TRENDS ANALYSIS<br />
143


