Child Poverty in Mozambique. A Situation and Trend ... - Unicef
Child Poverty in Mozambique. A Situation and Trend ... - Unicef
Child Poverty in Mozambique. A Situation and Trend ... - Unicef

You also want an ePaper? Increase the reach of your titles
YUMPU automatically turns print PDFs into web optimized ePapers that Google loves.
The associated large off-budget resource flows make the CGE a less than complete<br />
reflection of public resource allocations. In compil<strong>in</strong>g a series of sectoral expenditure<br />
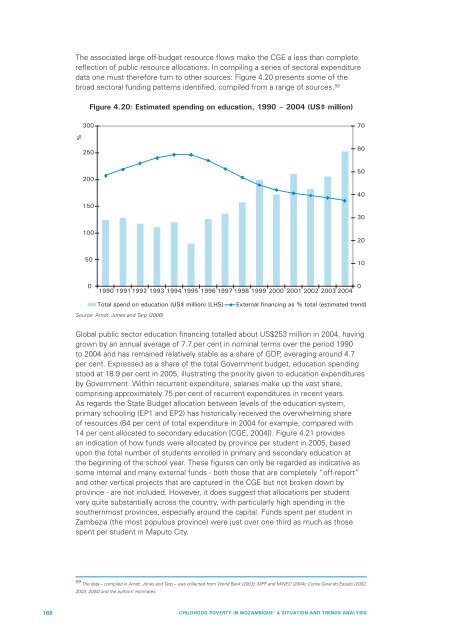
data one must therefore turn to other sources: Figure 4.20 presents some of the<br />
broad sectoral fund<strong>in</strong>g patterns identified, compiled from a range of sources. 59<br />
Figure 4.20: Estimated spend<strong>in</strong>g on education, 1990 – 2004 (US$ million)<br />
300<br />
70<br />
%<br />
250<br />
60<br />
200<br />
50<br />
40<br />
150<br />
30<br />
100<br />
20<br />
50<br />
0<br />
1990 1991 1992 1993 1994 1995 1996 1997 1998 1999 2000 2001 2002 2003 2004 0 10<br />
Total spend on education (US$ million) [LHS]<br />
Source: Arndt, Jones <strong>and</strong> Tarp (2006)<br />
External f<strong>in</strong>anc<strong>in</strong>g as % total (estimated trend)<br />
Global public sector education f<strong>in</strong>anc<strong>in</strong>g totalled about US$253 million <strong>in</strong> 2004, hav<strong>in</strong>g<br />
grown by an annual average of 7.7 per cent <strong>in</strong> nom<strong>in</strong>al terms over the period 1990<br />
to 2004 <strong>and</strong> has rema<strong>in</strong>ed relatively stable as a share of GDP, averag<strong>in</strong>g around 4.7<br />
per cent. Expressed as a share of the total Government budget, education spend<strong>in</strong>g<br />
stood at 18.9 per cent <strong>in</strong> 2005, illustrat<strong>in</strong>g the priority given to education expenditures<br />
by Government. With<strong>in</strong> recurrent expenditure, salaries make up the vast share,<br />
compris<strong>in</strong>g approximately 75 per cent of recurrent expenditures <strong>in</strong> recent years.<br />
As regards the State Budget allocation between levels of the education system,<br />
primary school<strong>in</strong>g (EP1 <strong>and</strong> EP2) has historically received the overwhelm<strong>in</strong>g share<br />
of resources (64 per cent of total expenditure <strong>in</strong> 2004 for example, compared with<br />
14 per cent allocated to secondary education [CGE, 2004]). Figure 4.21 provides<br />
an <strong>in</strong>dication of how funds were allocated by prov<strong>in</strong>ce per student <strong>in</strong> 2005, based<br />
upon the total number of students enrolled <strong>in</strong> primary <strong>and</strong> secondary education at<br />
the beg<strong>in</strong>n<strong>in</strong>g of the school year. These figures can only be regarded as <strong>in</strong>dicative as<br />
some <strong>in</strong>ternal <strong>and</strong> many external funds - both those that are completely “off-report”<br />
<strong>and</strong> other vertical projects that are captured <strong>in</strong> the CGE but not broken down by<br />
prov<strong>in</strong>ce - are not <strong>in</strong>cluded. However, it does suggest that allocations per student<br />
vary quite substantially across the country, with particularly high spend<strong>in</strong>g <strong>in</strong> the<br />
southernmost prov<strong>in</strong>ces, especially around the capital. Funds spent per student <strong>in</strong><br />
Zambezia (the most populous prov<strong>in</strong>ce) were just over one third as much as those<br />
spent per student <strong>in</strong> Maputo City.<br />
59 The data – compiled <strong>in</strong> Arndt, Jones <strong>and</strong> Tarp – was collected from World Bank (2003); MPF <strong>and</strong> MINED (2004); Conta Geral do Estado (2002,<br />
2003, 2004) <strong>and</strong> the authors’ estimates.<br />
166 CHILDHOOD POVERTY IN MOZAMBIQUE: A SITUATION AND TRENDS ANALYSIS