Child Poverty in Mozambique. A Situation and Trend ... - Unicef
Child Poverty in Mozambique. A Situation and Trend ... - Unicef
Child Poverty in Mozambique. A Situation and Trend ... - Unicef

You also want an ePaper? Increase the reach of your titles
YUMPU automatically turns print PDFs into web optimized ePapers that Google loves.
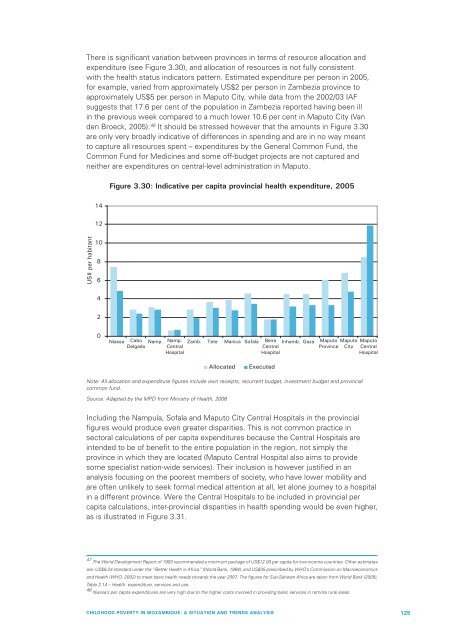
There is significant variation between prov<strong>in</strong>ces <strong>in</strong> terms of resource allocation <strong>and</strong><br />
expenditure (see Figure 3.30), <strong>and</strong> allocation of resources is not fully consistent<br />
with the health status <strong>in</strong>dicators pattern. Estimated expenditure per person <strong>in</strong> 2005,<br />
for example, varied from approximately US$2 per person <strong>in</strong> Zambezia prov<strong>in</strong>ce to<br />
approximately US$5 per person <strong>in</strong> Maputo City, while data from the 2002/03 IAF<br />
suggests that 17.6 per cent of the population <strong>in</strong> Zambezia reported hav<strong>in</strong>g been ill<br />
<strong>in</strong> the previous week compared to a much lower 10.6 per cent <strong>in</strong> Maputo City (Van<br />
den Broeck, 2005). 48 It should be stressed however that the amounts <strong>in</strong> Figure 3.30<br />
are only very broadly <strong>in</strong>dicative of differences <strong>in</strong> spend<strong>in</strong>g <strong>and</strong> are <strong>in</strong> no way meant<br />
to capture all resources spent – expenditures by the General Common Fund, the<br />
Common Fund for Medic<strong>in</strong>es <strong>and</strong> some off-budget projects are not captured <strong>and</strong><br />
neither are expenditures on central-level adm<strong>in</strong>istration <strong>in</strong> Maputo.<br />
Figure 3.30: Indicative per capita prov<strong>in</strong>cial health expenditure, 2005<br />
14<br />
12<br />
US$ per habitant<br />
10<br />
8<br />
6<br />
4<br />
2<br />
0<br />
Niassa<br />
Cabo<br />
Delgado Namp.<br />
Namp. Zamb. Tete Manica Sofala Beira Inhamb. Gaza<br />
Central<br />
Central<br />
Hospital<br />
Hospital<br />
Maputo Maputo<br />
Prov<strong>in</strong>ce City<br />
Maputo<br />
Central<br />
Hospital<br />
Allocated<br />
Executed<br />
Note: All allocation <strong>and</strong> expenditure figures <strong>in</strong>clude own receipts, recurrent budget, <strong>in</strong>vestment budget <strong>and</strong> prov<strong>in</strong>cial<br />
common fund.<br />
Source: Adapted by the MPD from M<strong>in</strong>istry of Health, 2006<br />
Includ<strong>in</strong>g the Nampula, Sofala <strong>and</strong> Maputo City Central Hospitals <strong>in</strong> the prov<strong>in</strong>cial<br />
figures would produce even greater disparities. This is not common practice <strong>in</strong><br />
sectoral calculations of per capita expenditures because the Central Hospitals are<br />
<strong>in</strong>tended to be of benefit to the entire population <strong>in</strong> the region, not simply the<br />
prov<strong>in</strong>ce <strong>in</strong> which they are located (Maputo Central Hospital also aims to provide<br />
some specialist nation-wide services). Their <strong>in</strong>clusion is however justified <strong>in</strong> an<br />
analysis focus<strong>in</strong>g on the poorest members of society, who have lower mobility <strong>and</strong><br />
are often unlikely to seek formal medical attention at all, let alone journey to a hospital<br />
<strong>in</strong> a different prov<strong>in</strong>ce. Were the Central Hospitals to be <strong>in</strong>cluded <strong>in</strong> prov<strong>in</strong>cial per<br />
capita calculations, <strong>in</strong>ter-prov<strong>in</strong>cial disparities <strong>in</strong> health spend<strong>in</strong>g would be even higher,<br />
as is illustrated <strong>in</strong> Figure 3.31.<br />
47 The World Development Report of 1993 recommended a m<strong>in</strong>imum package of US$12.00 per capita for low-<strong>in</strong>come countries. Other estimates<br />
are: US$9.24 st<strong>and</strong>ard under the “Better Health <strong>in</strong> Africa” (World Bank, 1994); <strong>and</strong> US$35 prescribed by WHO’s Commission on Macroeconomics<br />
<strong>and</strong> Health (WHO, 2002) to meet basic health needs towards the year 2007. The figures for Sub-Saharan Africa are taken from World Bank (2005),<br />
Table 2.14 – Health: expenditure, services <strong>and</strong> use.<br />
48 Niassa’s per capita expenditures are very high due to the higher costs <strong>in</strong>volved <strong>in</strong> provid<strong>in</strong>g basic services <strong>in</strong> remote rural areas.<br />
CHILDHOOD POVERTY IN MOZAMBIQUE: A SITUATION AND TRENDS ANALYSIS<br />
125