Child Poverty in Mozambique. A Situation and Trend ... - Unicef
Child Poverty in Mozambique. A Situation and Trend ... - Unicef
Child Poverty in Mozambique. A Situation and Trend ... - Unicef

Create successful ePaper yourself
Turn your PDF publications into a flip-book with our unique Google optimized e-Paper software.
B. Assess<strong>in</strong>g childhood poverty<br />
In address<strong>in</strong>g childhood poverty, it is vital to analyse whether the above picture <strong>in</strong><br />
relation to overall poverty <strong>in</strong> <strong>Mozambique</strong> reflects the picture for childhood poverty.<br />
This is done <strong>in</strong> two ways. Firstly, estimates of childhood poverty are presented drawn<br />
from the IAF us<strong>in</strong>g the official consumption-based measure. Secondly, childhood<br />
poverty is assessed us<strong>in</strong>g the Bristol Indicators, adapted for <strong>Mozambique</strong>.<br />
(i) Consumption-based measurement<br />
<strong>Child</strong> poverty headcount estimates were prepared based on the two household<br />
surveys. As noted above, the IAF does not measure the allocation of resources with<strong>in</strong><br />
the household directly <strong>and</strong> therefore measures apply only to an “average” household<br />
member. Thus, every child that lives <strong>in</strong> a household categorised as non-poor is<br />
considered to be non-poor.<br />
In l<strong>in</strong>e with national trends, the consumption-measure <strong>in</strong>dicates that the level of child<br />
poverty decreased significantly between 1996/1997 <strong>and</strong> 2002/2003. It also <strong>in</strong>dicates,<br />
however, that the level of poverty among children rema<strong>in</strong>s significantly higher than<br />
among adults, with 58 per cent of children liv<strong>in</strong>g <strong>in</strong> poverty compared to 49 per cent<br />
among adults <strong>in</strong> 2002/2003. Further, the gap between children <strong>and</strong> adults did not<br />
close between 1996/1997 <strong>and</strong> 2002/2003, with both groups witness<strong>in</strong>g a decrease of<br />
22 per cent <strong>in</strong> poverty level. The decrease <strong>in</strong> poverty levels was more pronounced <strong>in</strong><br />
rural areas (decrease by 24 per cent) than <strong>in</strong> urban areas (decrease by 16 per cent).<br />
Considerable disparities exist between prov<strong>in</strong>ces, with the percentage of children<br />
liv<strong>in</strong>g <strong>in</strong> poverty <strong>in</strong>creas<strong>in</strong>g over the period 1996/1997 to 2002/2003 <strong>in</strong> Cabo Delgado<br />
prov<strong>in</strong>ce, Maputo prov<strong>in</strong>ce <strong>and</strong> Maputo City. In these three prov<strong>in</strong>ces, poverty among<br />
children <strong>in</strong>creased more than among adults. In Maputo prov<strong>in</strong>ce, the gap between<br />
children <strong>and</strong> adults is notable, with the percentage of children liv<strong>in</strong>g <strong>in</strong> poverty<br />
<strong>in</strong>creas<strong>in</strong>g by 9 per cent compared with only 2 per cent among adults.<br />
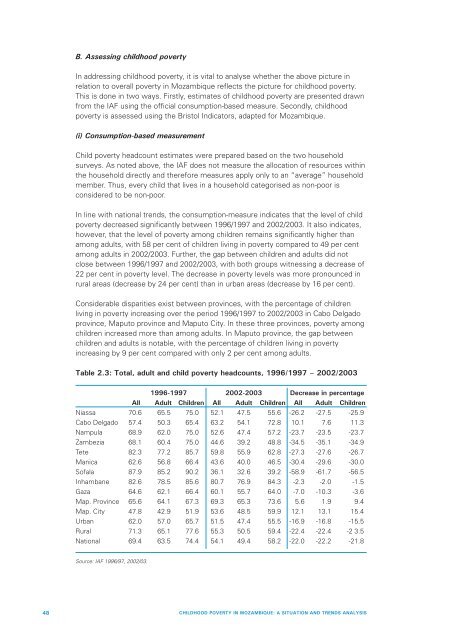
Table 2.3: Total, adult <strong>and</strong> child poverty headcounts, 1996/1997 – 2002/2003<br />
1996-1997 2002-2003 Decrease <strong>in</strong> percentage<br />
All Adult <strong>Child</strong>ren All Adult <strong>Child</strong>ren All Adult <strong>Child</strong>ren<br />
Niassa 70.6 65.5 75.0 52.1 47.5 55.6 -26.2 -27.5 -25.9<br />
Cabo Delgado 57.4 50.3 65.4 63.2 54.1 72.8 10.1 7.6 11.3<br />
Nampula 68.9 62.0 75.0 52.6 47.4 57.2 -23.7 -23.5 -23.7<br />
Zambezia 68.1 60.4 75.0 44.6 39.2 48.8 -34.5 -35.1 -34.9<br />
Tete 82.3 77.2 85.7 59.8 55.9 62.8 -27.3 -27.6 -26.7<br />
Manica 62.6 56.8 66.4 43.6 40.0 46.5 -30.4 -29.6 -30.0<br />
Sofala 87.9 85.2 90.2 36.1 32.6 39.2 -58.9 -61.7 -56.5<br />
Inhambane 82.6 78.5 85.6 80.7 76.9 84.3 -2.3 -2.0 -1.5<br />
Gaza 64.6 62.1 66.4 60.1 55.7 64.0 -7.0 -10.3 -3.6<br />
Map. Prov<strong>in</strong>ce 65.6 64.1 67.3 69.3 65.3 73.6 5.6 1.9 9.4<br />
Map. City 47.8 42.9 51.9 53.6 48.5 59.9 12.1 13.1 15.4<br />
Urban 62.0 57.0 65.7 51.5 47.4 55.5 -16.9 -16.8 -15.5<br />
Rural 71.3 65.1 77.6 55.3 50.5 59.4 -22.4 -22.4 -2 3.5<br />
National 69.4 63.5 74.4 54.1 49.4 58.2 -22.0 -22.2 -21.8<br />
Source: IAF 1996/97, 2002/03.<br />
48 CHILDHOOD POVERTY IN MOZAMBIQUE: A SITUATION AND TRENDS ANALYSIS