

Forging new pathways of research and innovation in open and distance learning
RW_2016_Oldenburg_Proceedings
RW_2016_Oldenburg_Proceedings

You also want an ePaper? Increase the reach of your titles
YUMPU automatically turns print PDFs into web optimized ePapers that Google loves.
Learn<strong>in</strong>g Analytics <strong>in</strong> Distance Education: A Systematic Literature Review<br />
Selcan Kilis, Yasem<strong>in</strong> Gülbahar<br />
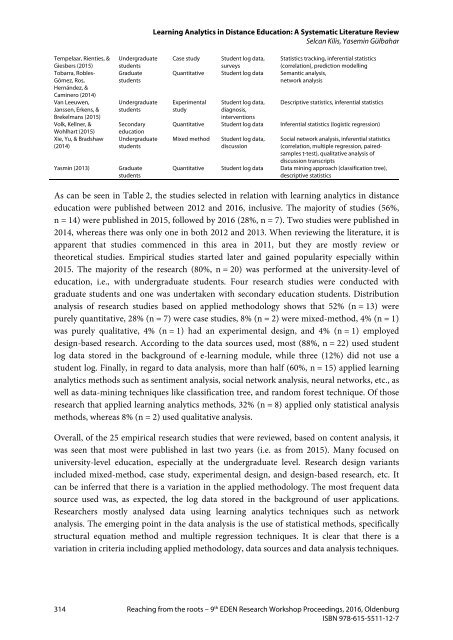
Tempelaar, Rienties, &<br />
Giesbers (2015)<br />
Tobarra, Robles-<br />
Gómez, Ros,<br />
Hernández, &<br />
Cam<strong>in</strong>ero (2014)<br />
Van Leeuwen,<br />
Janssen, Erkens, &<br />
Brekelmans (2015)<br />
Volk, Kellner, &<br />
Wohlhart (2015)<br />
Xie, Yu, & Bradshaw<br />
(2014)<br />
Yasm<strong>in</strong> (2013)<br />
Undergraduate<br />
students<br />
Graduate<br />
students<br />
Undergraduate<br />
students<br />
Secondary<br />
education<br />
Undergraduate<br />
students<br />
Graduate<br />
students<br />
Case study Student log data,<br />
surveys<br />
Statistics track<strong>in</strong>g, <strong>in</strong>ferential statistics<br />
(correlation), prediction modell<strong>in</strong>g<br />
Quantitative Student log data Semantic analysis,<br />
network analysis<br />
Experimental<br />
study<br />
Student log data,<br />
diagnosis,<br />
<strong>in</strong>terventions<br />
Descriptive statistics, <strong>in</strong>ferential statistics<br />
Quantitative Student log data Inferential statistics (logistic regression)<br />
Mixed method<br />
Student log data,<br />
discussion<br />
Social network analysis, <strong>in</strong>ferential statistics<br />
(correlation, multiple regression, pairedsamples<br />
t-test), qualitative analysis <strong>of</strong><br />
discussion transcripts<br />
Quantitative Student log data Data m<strong>in</strong><strong>in</strong>g approach (classification tree),<br />
descriptive statistics<br />
As can be seen <strong>in</strong> Table 2, the studies selected <strong>in</strong> relation with learn<strong>in</strong>g analytics <strong>in</strong> <strong>distance</strong><br />
education were published between 2012 <strong>and</strong> 2016, <strong>in</strong>clusive. The majority <strong>of</strong> studies (56%,<br />
n = 14) were published <strong>in</strong> 2015, followed by 2016 (28%, n = 7). Two studies were published <strong>in</strong><br />
2014, whereas there was only one <strong>in</strong> both 2012 <strong>and</strong> 2013. When review<strong>in</strong>g the literature, it is<br />
apparent that studies commenced <strong>in</strong> this area <strong>in</strong> 2011, but they are mostly review or<br />
theoretical studies. Empirical studies started later <strong>and</strong> ga<strong>in</strong>ed popularity especially with<strong>in</strong><br />
2015. The majority <strong>of</strong> the <strong>research</strong> (80%, n = 20) was performed at the university-level <strong>of</strong><br />
education, i.e., with undergraduate students. Four <strong>research</strong> studies were conducted with<br />
graduate students <strong>and</strong> one was undertaken with secondary education students. Distribution<br />
analysis <strong>of</strong> <strong>research</strong> studies based on applied methodology shows that 52% (n = 13) were<br />
purely quantitative, 28% (n = 7) were case studies, 8% (n = 2) were mixed-method, 4% (n = 1)<br />
was purely qualitative, 4% (n = 1) had an experimental design, <strong>and</strong> 4% (n = 1) employed<br />
design-based <strong>research</strong>. Accord<strong>in</strong>g to the data sources used, most (88%, n = 22) used student<br />
log data stored <strong>in</strong> the background <strong>of</strong> e-learn<strong>in</strong>g module, while three (12%) did not use a<br />
student log. F<strong>in</strong>ally, <strong>in</strong> regard to data analysis, more than half (60%, n = 15) applied learn<strong>in</strong>g<br />
analytics methods such as sentiment analysis, social network analysis, neural networks, etc., as<br />
well as data-m<strong>in</strong><strong>in</strong>g techniques like classification tree, <strong>and</strong> r<strong>and</strong>om forest technique. Of those<br />
<strong>research</strong> that applied learn<strong>in</strong>g analytics methods, 32% (n = 8) applied only statistical analysis<br />
methods, whereas 8% (n = 2) used qualitative analysis.<br />
Overall, <strong>of</strong> the 25 empirical <strong>research</strong> studies that were reviewed, based on content analysis, it<br />
was seen that most were published <strong>in</strong> last two years (i.e. as from 2015). Many focused on<br />
university-level education, especially at the undergraduate level. Research design variants<br />
<strong>in</strong>cluded mixed-method, case study, experimental design, <strong>and</strong> design-based <strong>research</strong>, etc. It<br />
can be <strong>in</strong>ferred that there is a variation <strong>in</strong> the applied methodology. The most frequent data<br />
source used was, as expected, the log data stored <strong>in</strong> the background <strong>of</strong> user applications.<br />
Researchers mostly analysed data us<strong>in</strong>g learn<strong>in</strong>g analytics techniques such as network<br />
analysis. The emerg<strong>in</strong>g po<strong>in</strong>t <strong>in</strong> the data analysis is the use <strong>of</strong> statistical methods, specifically<br />
structural equation method <strong>and</strong> multiple regression techniques. It is clear that there is a<br />
variation <strong>in</strong> criteria <strong>in</strong>clud<strong>in</strong>g applied methodology, data sources <strong>and</strong> data analysis techniques.<br />
314 Reach<strong>in</strong>g from the roots – 9 th EDEN Research Workshop Proceed<strong>in</strong>gs, 2016, Oldenburg<br />
ISBN 978-615-5511-12-7