

Energy and Human Ambitions on a Finite Planet, 2021a
Energy and Human Ambitions on a Finite Planet, 2021a
Energy and Human Ambitions on a Finite Planet, 2021a

You also want an ePaper? Increase the reach of your titles
YUMPU automatically turns print PDFs into web optimized ePapers that Google loves.
12 Wind <str<strong>on</strong>g>Energy</str<strong>on</strong>g> 190<br />
wind is not always blowing, <str<strong>on</strong>g>and</str<strong>on</strong>g> its speed varies over wide ranges. In<br />
this sense, wind is an intermittent power source. Just as for hydroelectric<br />
installati<strong>on</strong>s, wind resources are characterized by a regi<strong>on</strong>ally-dependent<br />
capacity factor, which is the ratio of energy delivered to what would<br />
have been delivered if the generati<strong>on</strong> facility operated at full capacity<br />
at all times. Typical capacity factors for wind in the U.S. 18 are around<br />
33%, <str<strong>on</strong>g>and</str<strong>on</strong>g> Figure 12.6 provides a visual sense for how this manifests in<br />
the real world: pretty erratic.<br />
18: Capacity factors for wind are smaller<br />
than for hydroelectricity due to wind being<br />
more variable than river flow.<br />
Figure 12.6: One m<strong>on</strong>th of wind generati<strong>on</strong><br />
from a 20 MW wind farm, illustrating the<br />
intermittent nature <str<strong>on</strong>g>and</str<strong>on</strong>g> why capacity factors<br />
are low [76]. The facility saturates at<br />
maximum power late in the m<strong>on</strong>th, selflimiting<br />
to avoid damage to the turbines.<br />
©2010 Springer.<br />
For very low wind speeds, 19 wind turbines do not have enough wind to<br />
turn at all <str<strong>on</strong>g>and</str<strong>on</strong>g> sit still at zero output. Furthermore, a turbine is rated at<br />
some maximum power output, which occurs at some moderately high<br />
wind speed, 20 bey<strong>on</strong>d which the generator risks damage—like “redlining”<br />
a car’s engine. When the wind climbs above this maximum-rated<br />
speed, the turbine is pegged at its maximum power—no l<strong>on</strong>ger following<br />
a v 3 relati<strong>on</strong>—<str<strong>on</strong>g>and</str<strong>on</strong>g> deliberately twists its blades 21 to be less efficient as<br />
the wind speed grows so that it maintains c<strong>on</strong>stant (maximum) power<br />
output. When the wind speed becomes large enough to endanger the<br />
turbine, it will twist its blades parallel to the wind to allow the air to<br />
pass without turning the rotor at all, so that it no l<strong>on</strong>ger spins while it<br />
“rides out” the high winds. 22<br />
19: . . . less than about 3 m/s; called the<br />
“cut-in” velocity<br />
20: . . . usually around 12–15 m/s<br />
21: The blades are like l<strong>on</strong>g airplane wings<br />
<str<strong>on</strong>g>and</str<strong>on</strong>g> are mounted so that they can be rotated<br />
<strong>on</strong> an axis running the length of the blade,<br />
allowing them to engage the wind at any<br />
angle, thus varying efficiency.<br />
22: A typical shut-off wind speed for turbines<br />
is 20–30 m/s.<br />
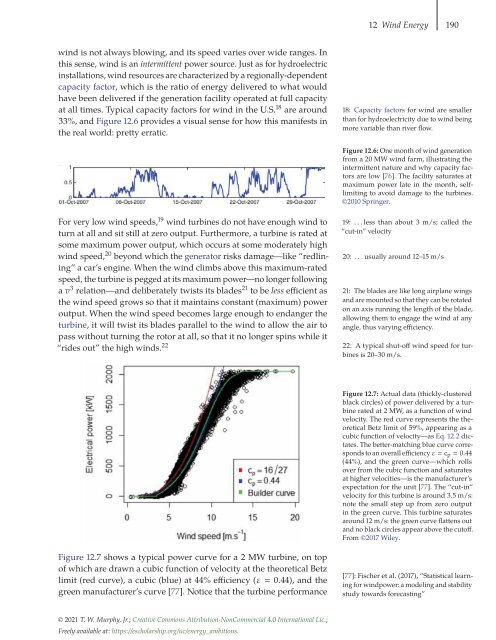
Figure 12.7: Actual data (thickly-clustered<br />
black circles) of power delivered by a turbine<br />
rated at 2 MW, as a functi<strong>on</strong> of wind<br />
velocity. The red curve represents the theoretical<br />
Betz limit of 59%, appearing as a<br />
cubic functi<strong>on</strong> of velocity—as Eq. 12.2 dictates.<br />
The better-matching blue curve corresp<strong>on</strong>ds<br />
to an overall efficiency ε c p 0.44<br />
(44%), <str<strong>on</strong>g>and</str<strong>on</strong>g> the green curve—which rolls<br />
over from the cubic functi<strong>on</strong> <str<strong>on</strong>g>and</str<strong>on</strong>g> saturates<br />
at higher velocities—is the manufacturer’s<br />
expectati<strong>on</strong> for the unit [77]. The “cut-in”<br />
velocity for this turbine is around 3.5 m/s:<br />
note the small step up from zero output<br />
in the green curve. This turbine saturates<br />
around 12 m/s: the green curve flattens out<br />
<str<strong>on</strong>g>and</str<strong>on</strong>g> no black circles appear above the cutoff.<br />
From ©2017 Wiley.<br />
Figure 12.7 shows a typical power curve for a2MWturbine, <strong>on</strong> top<br />
of which are drawn a cubic functi<strong>on</strong> of velocity at the theoretical Betz<br />
limit (red curve), a cubic (blue) at 44% efficiency (ε 0.44), <str<strong>on</strong>g>and</str<strong>on</strong>g> the<br />
green manufacturer’s curve [77]. Notice that the turbine performance<br />
[77]: Fischer et al. (2017), “Statistical learning<br />
for windpower: a modeling <str<strong>on</strong>g>and</str<strong>on</strong>g> stability<br />
study towards forecasting”<br />
© 2021 T. W. Murphy, Jr.; Creative Comm<strong>on</strong>s Attributi<strong>on</strong>-N<strong>on</strong>Commercial 4.0 Internati<strong>on</strong>al Lic.;<br />
Freely available at: https://escholarship.org/uc/energy_ambiti<strong>on</strong>s.


