

Energy and Human Ambitions on a Finite Planet, 2021a
Energy and Human Ambitions on a Finite Planet, 2021a
Energy and Human Ambitions on a Finite Planet, 2021a

You also want an ePaper? Increase the reach of your titles
YUMPU automatically turns print PDFs into web optimized ePapers that Google loves.
2 Ec<strong>on</strong>omic Growth Limits 24<br />
2.3 Physically Forced Ec<strong>on</strong>omic Limits<br />
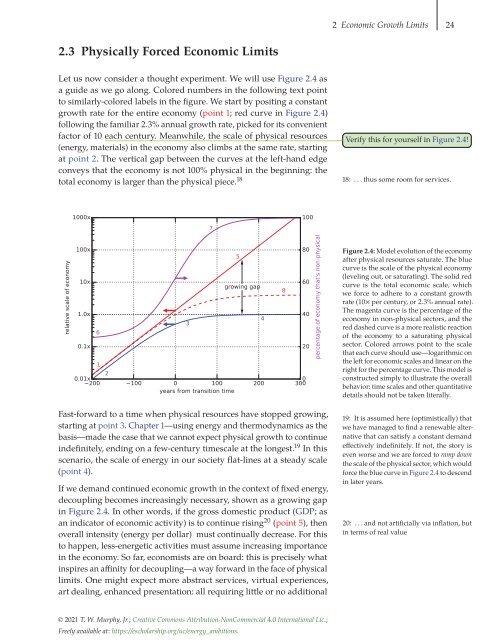
Let us now c<strong>on</strong>sider a thought experiment. We will use Figure 2.4 as<br />
a guide as we go al<strong>on</strong>g. Colored numbers in the following text point<br />
to similarly-colored labels in the figure. We start by positing a c<strong>on</strong>stant<br />
growth rate for the entire ec<strong>on</strong>omy (point 1; red curve in Figure 2.4)<br />
following the familiar 2.3% annual growth rate, picked for its c<strong>on</strong>venient<br />
factor of 10 each century. Meanwhile, the scale of physical resources<br />
(energy, materials) in the ec<strong>on</strong>omy also climbs at the same rate, starting<br />
at point 2. The vertical gap between the curves at the left-h<str<strong>on</strong>g>and</str<strong>on</strong>g> edge<br />
c<strong>on</strong>veys that the ec<strong>on</strong>omy is not 100% physical in the beginning: the<br />
total ec<strong>on</strong>omy is larger than the physical piece. 18<br />
Verify this for yourself in Figure 2.4!<br />
18: ...thussome room for services.<br />
1000x<br />
7<br />
100<br />
relative scale of ec<strong>on</strong>omy<br />
100x<br />
10x<br />
1.0x<br />
0.1x<br />
6<br />
1<br />
3<br />
2<br />
0.01x<br />
0<br />
−200 −100 0 100 200 300<br />
years from transiti<strong>on</strong> time<br />
5<br />
growing gap<br />
Fast-forward to a time when physical resources have stopped growing,<br />
starting at point 3. Chapter 1—using energy <str<strong>on</strong>g>and</str<strong>on</strong>g> thermodynamics as the<br />
basis—made the case that we cannot expect physical growth to c<strong>on</strong>tinue<br />
indefinitely, ending <strong>on</strong> a few-century timescale at the l<strong>on</strong>gest. 19 In this<br />
scenario, the scale of energy in our society flat-lines at a steady scale<br />
(point 4).<br />
If we dem<str<strong>on</strong>g>and</str<strong>on</strong>g> c<strong>on</strong>tinued ec<strong>on</strong>omic growth in the c<strong>on</strong>text of fixed energy,<br />
decoupling becomes increasingly necessary, shown as a growing gap<br />
in Figure 2.4. In other words, if the gross domestic product (GDP; as<br />
an indicator of ec<strong>on</strong>omic activity) is to c<strong>on</strong>tinue rising 20 (point 5), then<br />
overall intensity (energy per dollar) must c<strong>on</strong>tinually decrease. For this<br />
to happen, less-energetic activities must assume increasing importance<br />
in the ec<strong>on</strong>omy. So far, ec<strong>on</strong>omists are <strong>on</strong> board: this is precisely what<br />
inspires an affinity for decoupling—a way forward in the face of physical<br />
limits. One might expect more abstract services, virtual experiences,<br />
art dealing, enhanced presentati<strong>on</strong>: all requiring little or no additi<strong>on</strong>al<br />
4<br />
8<br />
80<br />
60<br />
40<br />
20<br />
percentage of ec<strong>on</strong>omy that's n<strong>on</strong>-physical<br />
Figure 2.4: Model evoluti<strong>on</strong> of the ec<strong>on</strong>omy<br />
after physical resources saturate. The blue<br />
curve is the scale of the physical ec<strong>on</strong>omy<br />
(leveling out, or saturating). The solid red<br />
curve is the total ec<strong>on</strong>omic scale, which<br />
we force to adhere to a c<strong>on</strong>stant growth<br />
rate (10× per century, or 2.3% annual rate).<br />
The magenta curve is the percentage of the<br />
ec<strong>on</strong>omy in n<strong>on</strong>-physical sectors, <str<strong>on</strong>g>and</str<strong>on</strong>g> the<br />
red dashed curve is a more realistic reacti<strong>on</strong><br />
of the ec<strong>on</strong>omy to a saturating physical<br />
sector. Colored arrows point to the scale<br />
that each curve should use—logarithmic <strong>on</strong><br />
the left for ec<strong>on</strong>omic scales <str<strong>on</strong>g>and</str<strong>on</strong>g> linear <strong>on</strong> the<br />
right for the percentage curve. This model is<br />
c<strong>on</strong>structed simply to illustrate the overall<br />
behavior: time scales <str<strong>on</strong>g>and</str<strong>on</strong>g> other quantitative<br />
details should not be taken literally.<br />
19: It is assumed here (optimistically) that<br />
we have managed to find a renewable alternative<br />
that can satisfy a c<strong>on</strong>stant dem<str<strong>on</strong>g>and</str<strong>on</strong>g><br />
effectively indefinitely. If not, the story is<br />
even worse <str<strong>on</strong>g>and</str<strong>on</strong>g> we are forced to ramp down<br />
the scale of the physical sector, which would<br />
force the blue curve in Figure 2.4 to descend<br />
in later years.<br />
20: . . . <str<strong>on</strong>g>and</str<strong>on</strong>g> not artificially via inflati<strong>on</strong>, but<br />
in terms of real value<br />
© 2021 T. W. Murphy, Jr.; Creative Comm<strong>on</strong>s Attributi<strong>on</strong>-N<strong>on</strong>Commercial 4.0 Internati<strong>on</strong>al Lic.;<br />
Freely available at: https://escholarship.org/uc/energy_ambiti<strong>on</strong>s.


