UNCTAD (2003). Tra<strong>de</strong> Preferences for LDCs: an early assessment of benefits and possible improvements.UNCTAD/ITCD/TSB/2003/8, agosto. Ginebra: UNCTAD.Sitios <strong>de</strong> Internet consultados:SPG en la UE: http://ec.europa.eu/tra<strong>de</strong>/issues/global/gsp/in<strong>de</strong>x_en.htmNormas <strong>de</strong> Origen SPG: http://europa.eu.int/comm/taxation_customs/customs/origin/gsp/in<strong>de</strong>x_es.htmTARIC on line: http://ec.europa.eu/taxation_customs/dds/tarhome_en.htmExport Help<strong>de</strong>sk: http://exporthelp.europa.eu/in<strong>de</strong>x_es.htmlEur Lex: http://eur-lex.europa.eu/146 <strong>Revista</strong> <strong><strong>de</strong>l</strong> <strong>CEI</strong> Número 15 - Agosto <strong>de</strong> 2009
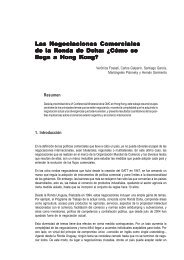
Anexo AImportaciones <strong>de</strong> la UE - Año 2007en miles <strong>de</strong> euros y porcentajePaísTotalesPor SPGBajo otras preferenciasSPG = 0 SPG > 0 Pref = 0 Pref > 0 NMF = 0 NMF > 0(a) (b) (c) (d) (e) (f) (g)NMF sin localizarPart. <strong>de</strong> las importacionespor SPG en el totalTotal Importaciones conarancel = 0Total importaciones conarancel = 0 opreferenciales(h) (i) = [(b) + (c)] / (a) (j) = [(b)+ (d) + (f)] / (a) (k) = Σ [(b) a (f)] / (a)Argentina 8.499.737 509.028 924.024 0 0 5.084.422 1.789.479 192.785 16,9% 65,8% 76,7%Bangla<strong>de</strong>sh 5.110.026 3.559.369 0 0 0 101.494 1.059.714 389.449 69,7% 71,6% 71,6%Brasil 32.134.010 2.383.119 1.986.213 0 0 20.680.735 6.342.577 741.366 13,6% 71,8% 78,0%China 230.607.385 642.018 1.257.293 0 0 106.147.521 120.505.434 2.055.120 0,8% 46,3% 46,9%India 26.414.991 5.093.564 6.579.726 0 0 9.717.251 4.012.537 1.011.913 44,2% 56,1% 81,0%Indonesia 12.690.638 1.126.381 1.910.866 0 6.497.313 2.387.019 769.058 23,9% 60,1% 75,1%Malasia 17.764.299 1.634.218 1.087.240 0 0 11.881.090 2.505.332 656.419 15,3% 76,1% 82,2%Pakistán 3.433.190 333.641 2.236.919 0 0 310.508 291.881 260.242 74,9% 18,8% 83,9%Arabia Saudita 18.281.439 1.119.535 950.227 0 0 15.189.452 201.355 820.869 11,3% 89,2% 94,4%Sudáfrica 20.292.048 737.620 271.925 3.672.249 602.951 13.014.338 1.421.769 571.195 5,0% 85,9% 90,2%Tailandia 16.533.397 2.178.051 2.040.358 0 0 6.254.574 5.342.318 718.095 25,5% 51,0% 63,3%Ucrania 11.056.309 1.019.752 1.215.243 0 0 7.423.000 1.193.617 204.697 20,2% 76,4% 87,4%Vietnam 7.843.219 729.333 2.480.103 0 0 2.446.848 1.443.997 742.937 40,9% 40,5% 72,1%Rusia 120.676.506 1.042.834 836.785 0 0 112.960.439 5.542.170 294.277 1,6% 94,5% 95,2%Subtotal 531.337.192 22.108.463 23.776.922 3.672.249 602.951 317.708.986 154.039.200 9.428.422 8,6% 64,6% 69,2%Resto 228.530.596 10.049.758 2.701.835 28.076.089 1.206.815 169.105.235 13.161.943 4.228.921 5,6% 90,7% 92,4%Total 178 paises 759.867.789 32.158.221 26.478.757 31.748.338 1.809.766 486.814.221 167.201.143 13.657.343 7,7% 72,5% 76,2%Fuente: <strong>CEI</strong> en base a Comisión Europea.Artículos<strong>Revista</strong> <strong><strong>de</strong>l</strong> <strong>CEI</strong>Comercio Exterior e Integración147
- Page 7:
Estructura del comercioexterior arg
- Page 12 and 13:
Cuadro 1Importaciones de bienes de
- Page 14 and 15:
80Variación porcentual interanual
- Page 16 and 17:
5. Comentarios finalesTeniendo en c
- Page 19:
2Panorama Mercosur
- Page 22 and 23:
1. Evolución institucional del MER
- Page 24 and 25:
1.1. Fondo para la Convergencia Est
- Page 26 and 27:
Existen diferentes actividades que
- Page 28 and 29:
mento del 26,3% respecto del primer
- Page 30 and 31:
Las importaciones del bloque en su
- Page 32 and 33:
Puede concluirse que en 2008 finali
- Page 34 and 35:
De todos modos, corresponde realiza
- Page 36 and 37:
. G r á f i c o 5Tasa de desempleo
- Page 38 and 39:
la caída de las cotizaciones de la
- Page 40 and 41:
conforme se aprecia en el Panorama
- Page 43:
3 CoyunturaEconómica Internacional
- Page 46 and 47:
La recomposición de la demanda se
- Page 48 and 49:
La alta tasa de desempleo seguirá
- Page 50 and 51:
especial atención a la solución d
- Page 52 and 53:
En primer lugar, la capitalización
- Page 55 and 56:
El G-20 y la Carta deActividad Econ
- Page 57 and 58:
Un último aspecto que destaca, se
- Page 59 and 60:
En cuanto a los alcances, se volcar
- Page 61 and 62:
Apoyó la incorporación de la OIT
- Page 63:
BibliografíaStancanelli, Néstor (
- Page 67 and 68:
NegociaciónMERCOSUR-SACU:análisis
- Page 69 and 70:
G r á f i c o 1Comercio de la Arge
- Page 71 and 72:
G r á f i c o 4Composición sector
- Page 73 and 74:
En general, estos capítulos (excep
- Page 75 and 76:
En el escenario de máxima se inclu
- Page 77 and 78:
Los productos que tienen aranceles
- Page 79 and 80:
5.2. Oferta del MERCOSUREl análisi
- Page 81 and 82:
Cuadro 10Subpartidas con mayor aume
- Page 83:
5 Artículos
- Page 86 and 87:
una gigantesca masa de inversiones
- Page 89 and 90:
Crisis ymedidas comerciales:¿regre
- Page 91 and 92:
Artículosempezó a mantener regist
- Page 93 and 94:
ArtículosPaíses de todas las regi
- Page 95 and 96: Artículosfiscal. Las alternativas
- Page 97 and 98: Artículos4. La respuesta de los go
- Page 99 and 100: ArtículosEntre los países que lib
- Page 101 and 102: Artículosimportaciones de juguetes
- Page 103 and 104: . Compras del gobiernoArtículosLa
- Page 105 and 106: Artículosy apoyo a la investigaci
- Page 107 and 108: ArtículosReflexiones sobre las med
- Page 109 and 110: ArtículosEstas medidas plantean in
- Page 111 and 112: ArtículosPaíses en desarrolloDent
- Page 113 and 114: ArtículosDada su magnitud, muchos
- Page 115 and 116: ArtículosClasificación de medidas
- Page 117 and 118: Artículosla eficiencia energética
- Page 119 and 120: ArtículosBibliografíaAgra Europe
- Page 121 and 122: ArtículosOMC (2009 d). La Crisis E
- Page 123: PaísesArancelesMedidas comerciales
- Page 126 and 127: Principio de la Nación más Favore
- Page 128 and 129: casi a todos los productos. Sólo q
- Page 130 and 131: 178 países con acceso al Sistema r
- Page 132 and 133: 1.4. Utilización del SPGLa utiliza
- Page 134 and 135: 2. Argentina y el Régimen General
- Page 136 and 137: 2.2. ElegibilidadComo se indicó en
- Page 138 and 139: (3 posiciones por 5,5 millones de e
- Page 140 and 141: Comunitarias elegibles, desde la Ar
- Page 142 and 143: Cuadro 10Niveles de Utilización po
- Page 144 and 145: 2.4.2. Utilidad por sectoresEn el C
- Page 148 and 149: Anexo BClasificación de las import
- Page 150 and 151: Anexo CClasificación de las import
- Page 152 and 153: Utilización Media (> 40% ≤ 90%)C
- Page 154 and 155: Anexo DClasificación de las import
- Page 157: 6 Biblioteca
- Page 160 and 161: Se ofrecen los siguientes servicios
- Page 162 and 163: Novedades bibliográficasLibros, ar
- Page 164 and 165: Espora, A.; López Monti, R. y R. R
- Page 166 and 167: Saez, G., (2009) “Análisis de te
- Page 168 and 169: Finanzas y desarrollo. Washington,
- Page 171 and 172: 7Anexo Estadístico
- Page 173 and 174: AnexoPIB a precios y tipos de cambi
- Page 175 and 176: AnexoPrincipales exportadores e imp
- Page 177 and 178: AnexoSaldo de la Cuenta Corrienteen
- Page 179 and 180: AnexoTasas de Desempleopromedio anu
- Page 181 and 182: AnexoIndice de Precios Mayorista (I