Revista del CEI - Centro de EconomÃa Internacional
Revista del CEI - Centro de EconomÃa Internacional
Revista del CEI - Centro de EconomÃa Internacional

You also want an ePaper? Increase the reach of your titles
YUMPU automatically turns print PDFs into web optimized ePapers that Google loves.
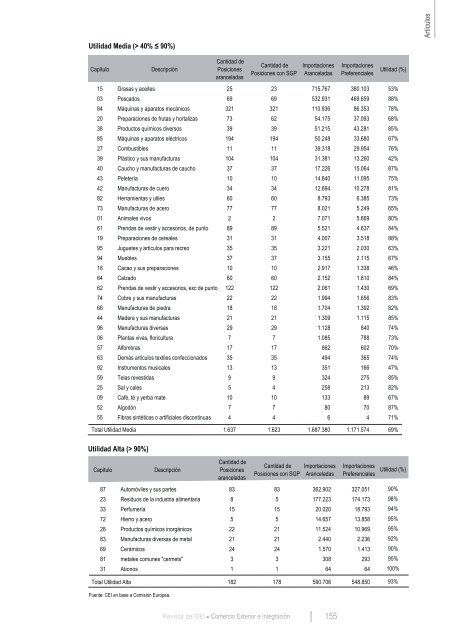
ArtículosUtilidad Media (> 40% ≤ 90%)CapítuloDescripciónCantidad <strong>de</strong>PosicionesaranceladasCantidad <strong>de</strong>Posiciones con SGPImportacionesAranceladasImportacionesPreferencialesUtilidad (%)15 Grasas y aceites 25 23 715.767 380.103 53%03 Pescados 69 69 532.931 469.659 88%84 Máquinas y aparatos mecánicos 321 321 110.936 86.353 78%20 Preparaciones <strong>de</strong> frutas y hortalizas 73 62 54.175 37.093 68%38 Productos químicos diversos 39 39 51.215 43.281 85%85 Máquinas y aparatos eléctricos 194 194 50.248 33.680 67%27 Combustibles 11 11 39.318 29.954 76%39 Plástico y sus manufacturas 104 104 31.381 13.260 42%40 Caucho y manufacturas <strong>de</strong> caucho 37 37 17.226 15.064 87%43 Peletería 10 10 14.840 11.095 75%42 Manufacturas <strong>de</strong> cuero 34 34 12.694 10.278 81%82 Herramientas y utiles 60 60 8.793 6.385 73%73 Manufacturas <strong>de</strong> acero 77 77 8.021 5.249 65%01 Animales vivos 2 2 7.071 5.669 80%61 Prendas <strong>de</strong> vestir y accesorios, <strong>de</strong> punto 89 89 5.521 4.637 84%19 Preparaciones <strong>de</strong> cereales 31 31 4.007 3.518 88%95 Juguetes y artículos para recreo 35 35 3.221 2.030 63%94 Muebles 37 37 3.155 2.115 67%18 Cacao y sus preparaciones 10 10 2.917 1.338 46%64 Calzado 60 60 2.152 1.810 84%62 Prendas <strong>de</strong> vestir y accesorios, exc <strong>de</strong> punto 122 122 2.061 1.430 69%74 Cobre y sus manufacturas 22 22 1.994 1.656 83%68 Manufacturas <strong>de</strong> piedra 18 18 1.704 1.392 82%44 Ma<strong>de</strong>ra y sus manufacturas 21 21 1.309 1.115 85%96 Manufacturas diversas 29 29 1.128 840 74%06 Plantas vivas, floricultura 7 7 1.085 788 73%57 Alfombras 17 17 862 602 70%63 Demás artículos textiles confeccionados 35 35 494 365 74%92 Instrumentos musicales 13 13 351 166 47%59 Telas revestidas 9 9 324 275 85%25 Sal y cales 5 4 258 213 82%09 Café, té y yerba mate 10 10 133 89 67%52 Algodón 7 7 80 70 87%55 Fibras sintéticas o artificiales discontinuas 4 4 6 4 71%Total Utilidad Media1.637 1.623 1.687.380 1.171.574 69%Utilidad Alta (> 90%)CapítuloDescripciónCantidad <strong>de</strong>PosicionesaranceladasCantidad <strong>de</strong>Posiciones con SGPImportacionesAranceladasImportacionesPreferencialesUtilidad (%)87 Automóviles y sus partes 83 83 362.902 327.051 90%23 Residuos <strong>de</strong> la industria alimentaria 8 5 177.223 174.173 98%33 Perfumería 15 15 20.020 18.793 94%72 Hierro y acero 5 5 14.657 13.858 95%28 Productos químicos inorgánicos 22 21 11.524 10.969 95%83 Manufacturas diversas <strong>de</strong> metal 21 21 2.440 2.236 92%69 Cerámicos 24 24 1.570 1.413 90%81 metales comunes "cermets" 3 3 308 293 95%31 Abonos 1 1 64 64 100%Total Utilidad Alta182 178 590.706 548.850 93%Fuente: <strong>CEI</strong> en base a Comisión Europea.<strong>Revista</strong> <strong><strong>de</strong>l</strong> <strong>CEI</strong>Comercio Exterior e Integración155