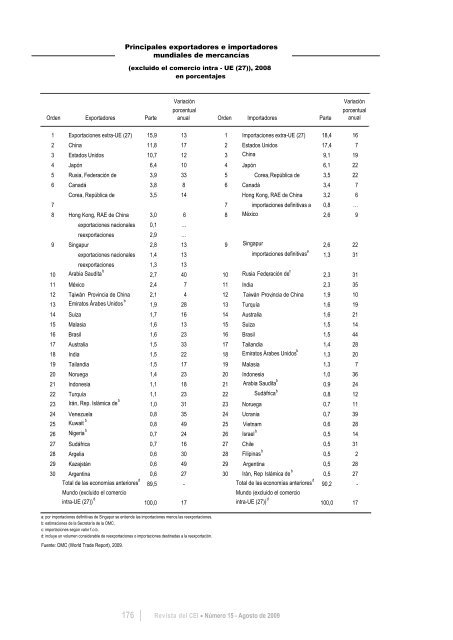
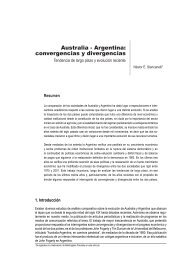
Principales exportadores e importadoresmundiales <strong>de</strong> mercancías(excluido el comercio intra - UE (27)), 2008en porcentajesOr<strong>de</strong>n Exportadores ParteVariaciónporcentualanualOr<strong>de</strong>n Importadores ParteVariaciónporcentualanual1 Exportaciones extra-UE (27) 15,9 13 1 Importaciones extra-UE (27) 18,4 162 China 11,8 17 2 Estados Unidos 17,4 73 Estados Unidos 10,7 12 3 China 9,1 194 Japón 6,4 10 4 Japón 6,1 225 Rusia, Fe<strong>de</strong>ración <strong>de</strong> 3,9 33 5 Corea, República <strong>de</strong> 3,5 226 Canadá 3,8 8 6 Canadá 3,4 7Corea, República <strong>de</strong> 3,5 14 Hong Kong, RAE <strong>de</strong> China 3,2 67 7 importaciones <strong>de</strong>finitivas a 0,8 …8 Hong Kong, RAE <strong>de</strong> China 3,0 6 8 México 2,6 9exportaciones nacionales 0,1 …reexportaciones 2,9 …9 Singapur 2,8 13 9 Singapur 2,6 22exportaciones nacionales 1,4 13 importaciones <strong>de</strong>finitivas a 1,3 31reexportaciones 1,3 1310 Arabia Saudita b 2,7 40 10 Rusia Fe<strong>de</strong>ración , <strong>de</strong> c 2,3 3111 México 2,4 7 11 India 2,3 3512 Taiwán , Provincia <strong>de</strong> China 2,1 4 12 Taiwán Provincia , <strong>de</strong> China 1,9 1013 Emiratos Árabes Unidos b 1,9 28 13 Turquía 1,6 1914 Suiza 1,7 16 14 Australia 1,6 2115 Malasia 1,6 13 15 Suiza 1,5 1416 Brasil 1,6 23 16 Brasil 1,5 4417 Australia 1,5 33 17 Tailandia 1,4 2818 India 1,5 22 18 Emiratos Árabes Unidos b 1,3 2019 Tailandia 1,5 17 19 Malasia 1,3 720 Noruega 1,4 23 20 Indonesia 1,0 3621 Indonesia 1,1 18 21 Arabia Saudita b 0,9 2422 Turquía 1,1 23 22 Sudáfrica b 0,8 1223 Irán, Rep. Islámica <strong>de</strong> b 1,0 31 23 Noruega 0,7 1124 Venezuela 0,8 35 24 Ucrania 0,7 3925 Kuwait b 0,8 49 25 Vietnam 0,6 2826 Nigeria b 0,7 24 26 Israel b 0,5 1427 Sudáfrica 0,7 16 27 Chile 0,5 3128 Argelia 0,6 30 28 Filipinas b 0,5 229 Kazajstán 0,6 49 29 Argentina 0,5 2830 Argentina 0,6 27 30 Irán, Rep . Islámica <strong>de</strong> b 0,5 27Total <strong>de</strong> las economías anteriores d 89,5 - Total <strong>de</strong> las economías anteriores d 90,2 -Mundo (excluido el comercioMundo (excluido el comerciointra-UE (27)) d 100,0 17intra-UE (27)) d 100,0 17a: por importaciones <strong>de</strong>finitivas <strong>de</strong> Singapur se entien<strong>de</strong> las importaciones menos las reexportaciones.b: estimaciones <strong>de</strong> la Secretaría <strong>de</strong> la OMC .c: importaciones según valor f.o.b.d: incluye un volumen consi<strong>de</strong>rable <strong>de</strong> reexportaciones o importaciones <strong>de</strong>stinadas a la reexportación.Fuente: OMC (World Tra<strong>de</strong> Report), 2009.176 <strong>Revista</strong> <strong><strong>de</strong>l</strong> <strong>CEI</strong> Número 15 - Agosto <strong>de</strong> 2009
AnexoSaldo <strong>de</strong> la Cuenta Corrienteen porcentaje <strong><strong>de</strong>l</strong> PIBPaíses 2002 2003 2004 2005 2006 2007Alemania 2,0 1,9 4,7 5,1 6,1 7,5 6,4Argentina 8,6 6,3 2,1 1,7 2,3 1,6 1,4Australia -3,8 -5,4 -6,1 -5,8 -5,3 -6,3 -4,2Austria 2,7 1,7 2,1 2,0 2,4 3,2 2,9Bélgica 4,6 4,1 3,5 2,6 2,6 1,7 -2,5Bolivia -4,1 1,0 3,8 6,5 11,3 13,2 11,5Brasil -1,7 0,8 1,8 1,6 1,3 0,1 -1,8Canadá 1,7 1,2 2,3 1,9 1,4 0,9 0,6Chile -0,9 -1,1 2,2 1,2 4,9 4,4 -2,0China 2,4 2,8 3,6 7,2 9,5 11,0 10,0Colombia -1,7 -1,2 -0,8 -1,3 -1,8 -2,8 -2,8Corea <strong><strong>de</strong>l</strong> Sur 1,0 2,0 3,9 1,8 0,6 0,6 -0,7Dinamarca 2,5 3,4 3,1 4,3 2,9 0,7 0,5Ecuador -4,8 -1,5 -1,7 0,8 3,9 2,3 2,4España -3,3 -3,5 -5,3 -7,4 -8,9 -10,1 -9,6Estados Unidos -4,4 -4,8 -5,3 -5,9 -6,0 -5,3 -4,7Filipinas -0,4 0,4 1,9 2,0 4,5 4,9 2,5Finlandia 8,8 5,1 6,6 3,6 4,5 4,1 2,5Francia 1,4 0,8 0,6 -0,6 -0,6 -1,0 -1,6Grecia -6,5 -6,4 -5,8 -7,5 -11,1 -14,1 -14,4Hong Kong, RAE <strong>de</strong> China 7,6 10,4 9,5 11,4 12,1 12,3 14,2India 1,4 1,5 0,1 -1,3 -1,1 -1,0 -2,8Indonesia 4,0 3,5 0,6 0,1 3,0 2,4 0,1Irlanda -1,0 0,0 -0,6 -3,5 -3,6 -5,4 -4,5Italia -0,8 -1,3 -0,9 -1,7 -2,6 -2,4 -3,2Japón 2,9 3,2 3,7 3,6 3,9 4,8 3,2Malasia 8,0 12,0 12,1 15,0 16,7 15,4 17,4México -2,2 -1,3 -0,7 -0,5 -0,5 -0,8 -1,4Nueva Zelandia -3,9 -4,3 -6,4 -8,5 -8,7 -8,2 -8,9Países Bajos 2,5 5,5 7,5 7,1 8,2 6,1 4,4Paraguay 1,8 2,3 2,1 0,3 0,5 0,7 -1,4Perú -1,9 -1,5 0,0 1,4 3,0 1,4 -3,3Polonia -2,5 -2,1 -4,0 -1,2 -2,7 -4,7 -5,5Portugal -8,1 -6,1 -7,6 -9,5 -10,1 -9,5 -12,0Reino Unido -1,6 -1,3 -2,1 -2,6 -3,4 -2,9 -1,7Rusia 8,4 8,2 10,1 11,0 9,5 5,9 6,1Singapur 12,6 23,2 18,1 22,7 25,4 23,5 14,8Sudáfrica 0,8 -1,1 -3,2 -4,0 -6,3 -7,3 -7,4Suecia 5,0 7,2 6,7 7,0 8,6 8,6 8,3Suiza 8,3 12,9 12,9 13,6 14,5 10,1 9,1Tailandia 3,7 3,4 1,7 -4,3 1,1 5,7 -0,1Taiwán, Provincia <strong>de</strong> China 8,6 9,6 6,0 4,9 7,2 8,6 6,4Turquía -0,7 -2,6 -3,7 -4,6 -6,0 -5,8 -5,7Uruguay 3,3 0,7 0,3 0,0 -2,3 -0,8 -3,6Venezuela 8,2 14,1 13,8 17,7 14,7 8,8 12,3Unión Europea 0,1 0,1 0,5 -0,1 -0,4 -0,6 -1,1Fuente: <strong>Centro</strong> <strong>de</strong> Economía <strong>Internacional</strong> en base a fuentes nacionales y FMI.2008<strong>Revista</strong> <strong><strong>de</strong>l</strong> <strong>CEI</strong> Comercio Exterior e Integración 177
- Page 7:
Estructura del comercioexterior arg
- Page 12 and 13:
Cuadro 1Importaciones de bienes de
- Page 14 and 15:
80Variación porcentual interanual
- Page 16 and 17:
5. Comentarios finalesTeniendo en c
- Page 19:
2Panorama Mercosur
- Page 22 and 23:
1. Evolución institucional del MER
- Page 24 and 25:
1.1. Fondo para la Convergencia Est
- Page 26 and 27:
Existen diferentes actividades que
- Page 28 and 29:
mento del 26,3% respecto del primer
- Page 30 and 31:
Las importaciones del bloque en su
- Page 32 and 33:
Puede concluirse que en 2008 finali
- Page 34 and 35:
De todos modos, corresponde realiza
- Page 36 and 37:
. G r á f i c o 5Tasa de desempleo
- Page 38 and 39:
la caída de las cotizaciones de la
- Page 40 and 41:
conforme se aprecia en el Panorama
- Page 43:
3 CoyunturaEconómica Internacional
- Page 46 and 47:
La recomposición de la demanda se
- Page 48 and 49:
La alta tasa de desempleo seguirá
- Page 50 and 51:
especial atención a la solución d
- Page 52 and 53:
En primer lugar, la capitalización
- Page 55 and 56:
El G-20 y la Carta deActividad Econ
- Page 57 and 58:
Un último aspecto que destaca, se
- Page 59 and 60:
En cuanto a los alcances, se volcar
- Page 61 and 62:
Apoyó la incorporación de la OIT
- Page 63:
BibliografíaStancanelli, Néstor (
- Page 67 and 68:
NegociaciónMERCOSUR-SACU:análisis
- Page 69 and 70:
G r á f i c o 1Comercio de la Arge
- Page 71 and 72:
G r á f i c o 4Composición sector
- Page 73 and 74:
En general, estos capítulos (excep
- Page 75 and 76:
En el escenario de máxima se inclu
- Page 77 and 78:
Los productos que tienen aranceles
- Page 79 and 80:
5.2. Oferta del MERCOSUREl análisi
- Page 81 and 82:
Cuadro 10Subpartidas con mayor aume
- Page 83:
5 Artículos
- Page 86 and 87:
una gigantesca masa de inversiones
- Page 89 and 90:
Crisis ymedidas comerciales:¿regre
- Page 91 and 92:
Artículosempezó a mantener regist
- Page 93 and 94:
ArtículosPaíses de todas las regi
- Page 95 and 96:
Artículosfiscal. Las alternativas
- Page 97 and 98:
Artículos4. La respuesta de los go
- Page 99 and 100:
ArtículosEntre los países que lib
- Page 101 and 102:
Artículosimportaciones de juguetes
- Page 103 and 104:
. Compras del gobiernoArtículosLa
- Page 105 and 106:
Artículosy apoyo a la investigaci
- Page 107 and 108:
ArtículosReflexiones sobre las med
- Page 109 and 110:
ArtículosEstas medidas plantean in
- Page 111 and 112:
ArtículosPaíses en desarrolloDent
- Page 113 and 114:
ArtículosDada su magnitud, muchos
- Page 115 and 116:
ArtículosClasificación de medidas
- Page 117 and 118:
Artículosla eficiencia energética
- Page 119 and 120:
ArtículosBibliografíaAgra Europe
- Page 121 and 122:
ArtículosOMC (2009 d). La Crisis E
- Page 123:
PaísesArancelesMedidas comerciales
- Page 126 and 127: Principio de la Nación más Favore
- Page 128 and 129: casi a todos los productos. Sólo q
- Page 130 and 131: 178 países con acceso al Sistema r
- Page 132 and 133: 1.4. Utilización del SPGLa utiliza
- Page 134 and 135: 2. Argentina y el Régimen General
- Page 136 and 137: 2.2. ElegibilidadComo se indicó en
- Page 138 and 139: (3 posiciones por 5,5 millones de e
- Page 140 and 141: Comunitarias elegibles, desde la Ar
- Page 142 and 143: Cuadro 10Niveles de Utilización po
- Page 144 and 145: 2.4.2. Utilidad por sectoresEn el C
- Page 146 and 147: UNCTAD (2003). Trade Preferences fo
- Page 148 and 149: Anexo BClasificación de las import
- Page 150 and 151: Anexo CClasificación de las import
- Page 152 and 153: Utilización Media (> 40% ≤ 90%)C
- Page 154 and 155: Anexo DClasificación de las import
- Page 157: 6 Biblioteca
- Page 160 and 161: Se ofrecen los siguientes servicios
- Page 162 and 163: Novedades bibliográficasLibros, ar
- Page 164 and 165: Espora, A.; López Monti, R. y R. R
- Page 166 and 167: Saez, G., (2009) “Análisis de te
- Page 168 and 169: Finanzas y desarrollo. Washington,
- Page 171 and 172: 7Anexo Estadístico
- Page 173 and 174: AnexoPIB a precios y tipos de cambi
- Page 175: AnexoPrincipales exportadores e imp
- Page 179 and 180: AnexoTasas de Desempleopromedio anu
- Page 181 and 182: AnexoIndice de Precios Mayorista (I