- Page 1 and 2:
Instruction Manual Process Unit 73
- Page 3 and 4:
Changes for Software Release 6 Proc
- Page 5 and 6:
Safety Information Be sure to read
- Page 7 and 8:
Information on Electromagnetic Comp
- Page 9 and 10:
The representation of a menu in thi
- Page 11 and 12:
Contents Safety Information . . . .
- Page 13 and 14:
9 Capabilities of the Process Unit
- Page 15 and 16:
1 Overview of the Process Unit 73 L
- Page 17 and 18:
vanic isolation optional) allows li
- Page 19 and 20:
2 Operating the Process Unit 73 LF
- Page 21 and 22:
Control Elements Pressing menu key
- Page 23 and 24:
How to select a menu item Press scr
- Page 25 and 26:
How to keep the old setting Pressin
- Page 27 and 28:
3 Diagnostics Menu What you can do
- Page 29 and 30:
How to enter the point of measureme
- Page 31 and 32:
Device Diagnostics What you can do
- Page 33 and 34:
4 Maintenance Menu What you can do
- Page 35 and 36:
Resistance Measurement Press and
- Page 37 and 38:
Temperature Probe Adjustment This f
- Page 39 and 40:
5 Viewing Level What you can do on
- Page 41 and 42:
6 Calibration Why do you have to ca
- Page 43 and 44:
How to select a calibration sequenc
- Page 45 and 46:
Automatic Calibration with Standard
- Page 47 and 48:
Calibration by Manual Entry of Cond
- Page 49 and 50:
Calibration by Entry of Premeasured
- Page 51 and 52:
With TC correction T ref = 25 °C W
- Page 53 and 54:
7 Operator Level What you can do on
- Page 55 and 56:
8 Administrator Level Before commis
- Page 57 and 58:
An Example You want to change the s
- Page 59 and 60:
How to set the administrator passco
- Page 61 and 62:
9 Capabilities of the Process Unit
- Page 63 and 64:
Pt 100/ Pt 1000/ Ni 100 Process Uni
- Page 65 and 66:
wt pk bn gy bu gn rd yw Shi
- Page 67 and 68:
Conductivity Measurement using ZU 0
- Page 69 and 70:
Sensor cable Terminal box ZU 0307 E
- Page 71 and 72:
Sensor cable Terminal box ZU 0307 g
- Page 73 and 74:
Calibration Solution for Automatic
- Page 75 and 76:
Manual Temperature Compensation Man
- Page 77 and 78:
How to define temperature compensat
- Page 79 and 80:
Trilinear Output Curve output curre
- Page 81 and 82:
2nd Current Output If your unit is
- Page 83 and 84:
100 Trilinear (Bilinear) Curve (fal
- Page 85 and 86:
How to set the parameters for conce
- Page 87 and 88:
Complete Installation using all Fun
- Page 89 and 90:
NAMUR Contacts The three NAMUR cont
- Page 91 and 92:
During calibration the limit contac
- Page 93 and 94:
In measuring mode the present value
- Page 95 and 96:
Output 2 can be used to control val
- Page 97 and 98:
The information text shows the cont
- Page 99 and 100:
ÍÍÍÍÍÍÍÍÍÍÍÍ ÍÍÍÍÍ
- Page 101 and 102:
Error Messages for Controller Setti
- Page 103 and 104:
How to set the current input parame
- Page 105 and 106:
Cleaning: The contact ”cleaning
- Page 107 and 108:
How to set the rinsing cycle parame
- Page 109 and 110:
Remote Interface Operation You can
- Page 111 and 112:
How to set the interface parameters
- Page 113 and 114:
10 Information on Mounting and Inst
- Page 115 and 116:
front removable for instrument inst
- Page 117 and 118:
Installation Installation of the Pr
- Page 119:
Maintenance and Cleaning The Proces
- Page 122 and 123:
Process Unit 73 LF Error Message (D
- Page 124 and 125: Process Unit 73 LF According to Int
- Page 126 and 127: Process Unit 73 LF 11-6 Error Messa
- Page 128 and 129: Process Unit 73 LF Output Current 1
- Page 130 and 131: Process Unit 73 LF Transmission beh
- Page 132 and 133: Process Unit 73 LF STATUS Commands:
- Page 134 and 135: Process Unit 73 LF Device Diagnosti
- Page 136 and 137: Process Unit 73 LF Clock RPRTM WPRT
- Page 138 and 139: Process Unit 73 LF WPDISLAI1 Displa
- Page 140 and 141: Process Unit 73 LF RPTOMA WPTOMA0 W
- Page 142 and 143: Process Unit 73 LF Output Current 1
- Page 144 and 145: Process Unit 73 LF Output 2/Control
- Page 146 and 147: Process Unit 73 LF Limit Contacts/C
- Page 148 and 149: Process Unit 73 LF RPCIBV WPCIBVp R
- Page 150 and 151: Process Unit 73 LF Current Input RP
- Page 152 and 153: Process Unit 73 LF Automatic Device
- Page 154 and 155: Process Unit 73 LF Digital Controll
- Page 156 and 157: Process Unit 73 LF Interface Bus Pr
- Page 158 and 159: Process Unit 73 LF 4th Field: CRC16
- Page 160 and 161: Process Unit 73 LF Interface Bus Pr
- Page 162 and 163: Process Unit 73 LF Mounting Accesso
- Page 164 and 165: Process Unit 73 LF Display Display
- Page 166 and 167: Process Unit 73 LF Cells Model SE 6
- Page 168 and 169: Process Unit 73 LF Model ZU 0071*)
- Page 170 and 171: Process Unit 73 LF cable length app
- Page 172 and 173: Process Unit 73 LF 1 Observe instal
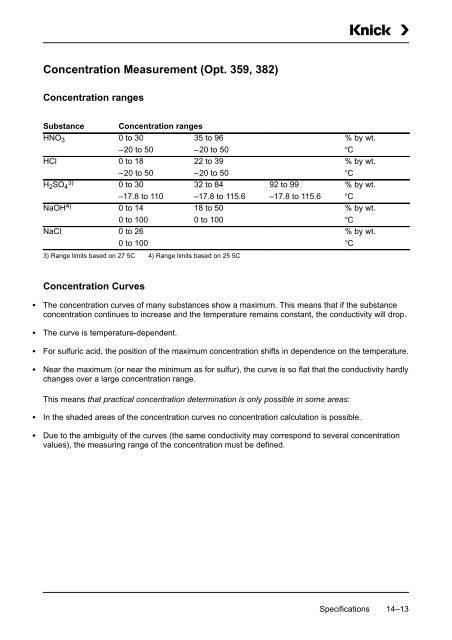
- Page 176 and 177: Process Unit 73 LF [mS/cm] 1,200 H
- Page 178 and 179: Process Unit 73 LF 700 [mS/cm] Sal
- Page 180 and 181: Process Unit 73 LF Sodium Chloride
- Page 182 and 183: Process Unit 73 LF EPROM Replacemen
- Page 184 and 185: Process Unit 73 LF 16-4 Appendix
- Page 186 and 187: Process Unit 73 LF conductance cond
- Page 188 and 189: Process Unit 73 LF Parameter Settin
- Page 190 and 191: Process Unit 73 LF cell, SE 603 app
- Page 192 and 193: Process Unit 73 LF limit contacts/c
- Page 194: Process Unit 73 LF viewing angle ad