Process Unit 73 LF - Knick
Process Unit 73 LF - Knick
Process Unit 73 LF - Knick

You also want an ePaper? Increase the reach of your titles
YUMPU automatically turns print PDFs into web optimized ePapers that Google loves.
<strong>Process</strong> <strong>Unit</strong> <strong>73</strong> <strong>LF</strong><br />
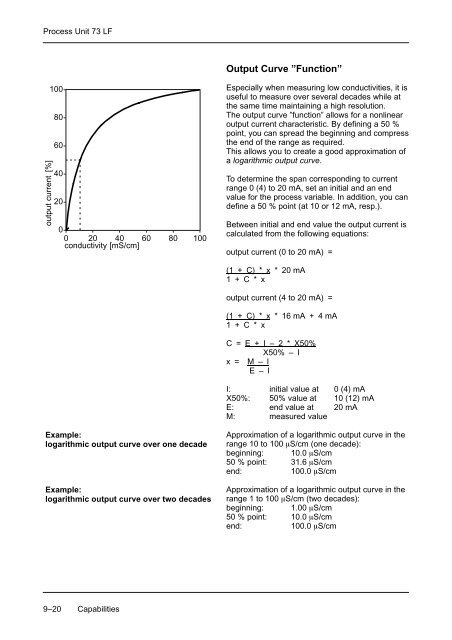
Output Curve ”Function”<br />
output current [%]<br />
100<br />
80<br />
60<br />
40<br />
20<br />
0<br />
0 20 40 60 80 100<br />
conductivity [mS/cm]<br />
Especially when measuring low conductivities, it is<br />
useful to measure over several decades while at<br />
the same time maintaining a high resolution.<br />
The output curve ”function” allows for a nonlinear<br />
output current characteristic. By defining a 50 %<br />
point, you can spread the beginning and compress<br />
the end of the range as required.<br />
This allows you to create a good approximation of<br />
a logarithmic output curve.<br />
To determine the span corresponding to current<br />
range 0 (4) to 20 mA, set an initial and an end<br />
value for the process variable. In addition, you can<br />
define a 50 % point (at 10 or 12 mA, resp.).<br />
Between initial and end value the output current is<br />
calculated from the following equations:<br />
output current (0 to 20 mA) =<br />
(1 + C) * x * 20 mA<br />
1 + C * x<br />
output current (4 to 20 mA) =<br />
(1 + C) * x * 16 mA + 4 mA<br />
1 + C * x<br />
C = E + I – 2 * X50%<br />
X50% – I<br />
x = M – I<br />
E – I<br />
I: initial value at 0 (4) mA<br />
X50%: 50% value at 10 (12) mA<br />
E: end value at 20 mA<br />
M: measured value<br />
Example:<br />
logarithmic output curve over one decade<br />
Example:<br />
logarithmic output curve over two decades<br />
Approximation of a logarithmic output curve in the<br />
range 10 to 100 S/cm (one decade):<br />
beginning: 10.0 S/cm<br />
50 % point: 31.6 S/cm<br />
end:<br />
100.0 S/cm<br />
Approximation of a logarithmic output curve in the<br />
range 1 to 100 S/cm (two decades):<br />
beginning: 1.00 S/cm<br />
50 % point: 10.0 S/cm<br />
end:<br />
100.0 S/cm<br />
9–20 Capabilities