- Page 1 and 2:
An Investigation into the Ability o
- Page 3 and 4:
Abstract Recent studies have establ
- Page 5 and 6:
Christine Malcolm (Chief Speech and
- Page 7 and 8:
2.6.2.1 Lesion size and site 37 2.6
- Page 9 and 10:
3.6.1.2 Number and type of items to
- Page 11 and 12:
4.8 Chapter summary 132 Chapter 5 T
- Page 13 and 14:
5.9.1.1 Personal attributes 176 5.9
- Page 15 and 16:
5.15.1.1 Personal attributes 208 5.
- Page 17 and 18:
6.3.3.5 The impact of clock drawing
- Page 19 and 20:
Appendices 2.1 Main representative
- Page 21 and 22:
5.2 Raw and percentage scores for n
- Page 23 and 24:
Figures 2i Cognitive neuropsycholog
- Page 25 and 26:
Younger people who are having and s
- Page 27 and 28:
Chapter 2 Review of the literature
- Page 29 and 30:
sentences. As aphasia also affects
- Page 31 and 32:
continue to experience significant
- Page 33 and 34:
noted that there were three areas t
- Page 35 and 36:
natural reaction to the loss of abi
- Page 37 and 38:
2.3.3 Impact of aphasia on the fami
- Page 39 and 40:
facets of a person’s life as well
- Page 41 and 42:
with the literature regarding the l
- Page 43 and 44:
Rehabilitation is not thought to al
- Page 45 and 46:
everything that we learn and experi
- Page 47 and 48:
eorganisation in hemiplegic stroke
- Page 49 and 50:
(Kasten and Sabel, 1995) and replic
- Page 51 and 52:
1998), tingling, itching or painful
- Page 53 and 54:
Emission Tomography (PET) scans ana
- Page 55 and 56:
ehabilitation, function can be limi
- Page 57 and 58:
Studies have not always found age t
- Page 59 and 60:
larger intracranial capacity could
- Page 61 and 62:
permanent loss of particular skills
- Page 63 and 64:
depression in people with severe ap
- Page 65 and 66:
maintenance of permanent records of
- Page 67 and 68:
intensity aphasia rehabilitation wa
- Page 69 and 70:
2.7 CURRENT THEORETICAL ACCOUNTS OF
- Page 71 and 72:
people with apparently similar char
- Page 73 and 74:
Additionally, harmful or redundant
- Page 75 and 76:
information about a word (Harley, 2
- Page 77 and 78:
(as in semantic dementia) as well a
- Page 79 and 80:
esearchers (Breedin et al., 1998; W
- Page 81 and 82:
As many adults have acquired a wide
- Page 83 and 84:
healthy individuals as mentioned ab
- Page 85 and 86:
et al. (2001) evaluated the ability
- Page 87 and 88:
of new vocabulary where both the wo
- Page 89 and 90:
syllables in each word, therefore t
- Page 91 and 92:
vocabulary; facilitate the demonstr
- Page 93 and 94:
methodology developed and used in t
- Page 95 and 96:
Chapter 3 Preliminary Studies 3.1 I
- Page 97 and 98:
for the main investigation by the n
- Page 99 and 100:
3.2.1.4 Delayed recall Approximatel
- Page 101 and 102:
written recall assessment task (par
- Page 103 and 104:
indicates a large reduction of item
- Page 105 and 106:
ehearsal taking place prior to the
- Page 107 and 108:
one were discussed with each partic
- Page 109 and 110:
Graph 3.2 Comparison of number of i
- Page 111 and 112: As with preliminary study one, part
- Page 113 and 114: during the training session, some p
- Page 115 and 116: 3.5 PRELIMINARY STUDY FOUR This stu
- Page 117 and 118: Fifty four percent of participants
- Page 119 and 120: preliminary studies the British Nat
- Page 121 and 122: where main investigation participan
- Page 123 and 124: perhaps reduce the number of items
- Page 125 and 126: preliminary studies as described in
- Page 127 and 128: emember the route taking them from
- Page 129 and 130: 4.3 TRAINING SESSION PROCEDURE Each
- Page 131 and 132: 4.3.2.1 Training of stimuli: phonol
- Page 133 and 134: assessments was administered both i
- Page 135 and 136: to match the name and skill present
- Page 137 and 138: 4.4.3 Results of P1’s post-traini
- Page 139 and 140: Table 4.4 Pilot Study One Total raw
- Page 141 and 142: session. This reflected the general
- Page 143 and 144: 4.4.5 Summary of pilot study one Pi
- Page 145 and 146: 4.5.2 Results of P2’s performance
- Page 147 and 148: P2 recalled 14 (70%) of the new wor
- Page 149 and 150: demonstrate this learning during im
- Page 151 and 152: 4.6.3 Methodological issues A numbe
- Page 153 and 154: would be asked not to repeat the wo
- Page 155 and 156: 4.8 CHAPTER SUMMARY The three pilot
- Page 157 and 158: Chapter 5 Main Investigation 5.1 IN
- Page 159 and 160: - The medical stability of particip
- Page 161: The methodology for the training an
- Page 165 and 166: the immediate recall was not the sa
- Page 167 and 168: Table 5.5 Characteristics of error
- Page 169 and 170: scores (Zigmond and Snaith, 1983) a
- Page 171 and 172: expected that younger participants
- Page 173 and 174: 5.4.2.3 Severity of aphasia While t
- Page 175 and 176: 5.5 PARTICIPANT C1 Participant C1
- Page 177 and 178: SPOKEN WORD PICTURE WRITTEN WORD Au
- Page 179 and 180: written form again without the aid
- Page 181 and 182: vocabulary than younger participant
- Page 183 and 184: was non-fluent with many repetition
- Page 185 and 186: emembering 49% of information origi
- Page 187 and 188: 5.7.1.1 Personal attributes C2 was
- Page 189 and 190: GOB pathways). C2’s speech was ch
- Page 191 and 192: assessment tasks (see Table 5.2), w
- Page 193 and 194: 5.8.1.1 Personal attributes C3 was
- Page 195 and 196: C3’s narration of the Cinderella
- Page 197 and 198: errors with six out of the 20 new w
- Page 199 and 200: 5.9.1.1 Personal attributes C4 was
- Page 201 and 202: 5.9.1.4 Rehearsal and consolidation
- Page 203 and 204: achieved 100% recognition on the li
- Page 205 and 206: 5.10.1.1 Personal attributes C5 was
- Page 207 and 208: any other fictional stories so he w
- Page 209 and 210: the reading task. C5 matched eight
- Page 211 and 212: 5.11.1.1 Personal attributes C6 was
- Page 213 and 214:
some word-finding difficulties with
- Page 215 and 216:
5.12 PARTICIPANT C7 Participant C7
- Page 217 and 218:
pathways), spell words and non-word
- Page 219 and 220:
(reading) words she made 15 false p
- Page 221 and 222:
5.13.1.1 Personal attributes C8 was
- Page 223 and 224:
and PLC pathways). C8’s speech wa
- Page 225 and 226:
5.14 PARTICIPANT C9 Participant C9
- Page 227 and 228:
C9’s data (see Table 5.26 and Fig
- Page 229 and 230:
assessments indicated that she had
- Page 231 and 232:
5.15.1.1 Personal attributes C10 wa
- Page 233 and 234:
naming. C10 had some difficulties c
- Page 235 and 236:
5.16 PARTICIPANT C11 Participant C1
- Page 237 and 238:
SPOKEN WORD PICTURE WRITTEN WORD Au
- Page 239 and 240:
Table 5.31 C11’s detailed perform
- Page 241 and 242:
influencing factors (for example, a
- Page 243 and 244:
each participant’s relevant data,
- Page 245 and 246:
Table 5.32 Hierarchical cluster ana
- Page 247 and 248:
for months post-stroke, severity of
- Page 249 and 250:
Table 5.33 Correlation co-efficient
- Page 251 and 252:
Table 5.35 Correlation co-efficient
- Page 253 and 254:
Table 5.39 Correlation co-efficient
- Page 255 and 256:
ecency and primacy effect, however,
- Page 257 and 258:
drawing skills and the ability to l
- Page 259 and 260:
with the creation of new neuronal c
- Page 261 and 262:
5.8.2.1). Secondly, the participant
- Page 263 and 264:
6.3.1.1 The impact of age on the le
- Page 265 and 266:
education that an individual experi
- Page 267 and 268:
unethical, even perhaps illegal, to
- Page 269 and 270:
assessment and treatment of emotion
- Page 271 and 272:
theories on the negative effects of
- Page 273 and 274:
(CLQT) was developed as a screening
- Page 275 and 276:
6.3.3.2 The impact of memory on the
- Page 277 and 278:
(executive scores of moderate, mild
- Page 279 and 280:
320). Additionally, the CLQT indica
- Page 281 and 282:
6.3.4.1 Pre-training language scree
- Page 283 and 284:
abilities of each participant and a
- Page 285 and 286:
person with aphasia only ever produ
- Page 287 and 288:
6.4.2 Methodology As previous resea
- Page 289 and 290:
assessing the learning of new vocab
- Page 291 and 292:
provided flexibility not only for s
- Page 293 and 294:
presentation. It was proposed that
- Page 295 and 296:
participants also lexicalised the n
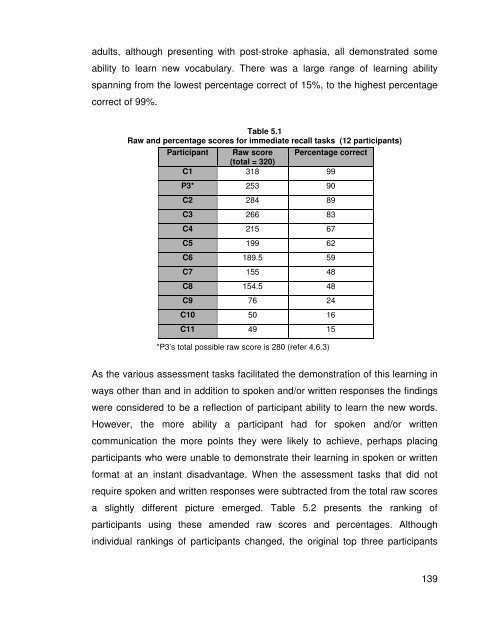
- Page 297 and 298:
module and how it communicates with
- Page 299 and 300:
theory of rehabilitation and in rel
- Page 301 and 302:
experience in different ways and ch
- Page 303 and 304:
upon language rehabilitation, for e
- Page 305 and 306:
the investigation of people with po
- Page 307 and 308:
Further statistical analyses with a
- Page 309 and 310:
extend the examination of the abili
- Page 311 and 312:
task), severity of aphasia and amou
- Page 313 and 314:
References Alexander, M. P. (1994)
- Page 315 and 316:
Candia, V., Schafer, Th., Taub, E.,
- Page 317 and 318:
Fillingham, J. K., Sage, K. and Lam
- Page 319 and 320:
Howard and Hatfield (1987) Aphasia
- Page 321 and 322:
Linebaugh, C. W. (1999) Merging the
- Page 323 and 324:
Nation, I. S. P. (1983) Teaching an
- Page 325 and 326:
Scheibel, A., Conrad, T., Perdue, S
- Page 327 and 328:
Warrington, E. K. and McCarthy (198
- Page 329 and 330:
Appendix 3.1 Preliminary study one:
- Page 331 and 332:
Appendix 3.2 (continued) Preliminar
- Page 333 and 334:
Appendix 3.4a Preliminary study two
- Page 335 and 336:
Appendix 3.6 Stimuli used for the m
- Page 337 and 338:
Appendix 3.6 (continued) Stimuli us
- Page 339 and 340:
Appendix 4.1 Methods of learning ne
- Page 341 and 342:
Appendix 4.2 Hospital Anxiety and D
- Page 343 and 344:
Appendix 4.2 (Continued) Hospital A
- Page 345 and 346:
Appendix 4.4 Non-linguistic learnin
- Page 347 and 348:
Appendix 4.5 Language screening ass
- Page 349 and 350:
Appendix 4.6 Familiar, trained and
- Page 351 and 352:
Appendix 4.8 Examples of written an
- Page 353 and 354:
APPENDIX 5.2 Participant consent fo
- Page 355 and 356:
Appendix 5.3 (Continued) Narrations
- Page 357 and 358:
Appendix 5.3 (Continued) Narrations
- Page 359 and 360:
Appendix 5.4 (continued) Hierarchic
- Page 361 and 362:
Appendix 5.4 (continued) Hierarchic
- Page 363 and 364:
Appendix 5.4 (continued) Hierarchic
- Page 365 and 366:
Appendix 5.5 (continued) Group corr
- Page 367 and 368:
Appendix 5.5 (continued) Group corr
- Page 369:
Appendix 5.7 Total recall of tasks