- Page 1 and 2:
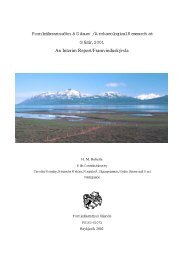
VATNSFJÖRÐUR 2010 FRAMVINDUSKÝRS
- Page 3 and 4:
EFNI / CONTENTS Vatnsfjörður 2003
- Page 5 and 6:
SAMANTEKT Garðar Guðmundsson Forn
- Page 7 and 8:
Sem fyrr voru nemendur víða að,
- Page 9 and 10:
tóbakspípum, ofnum og prjónuðum
- Page 11 and 12:
q Borgarey Mjóifjörður Skálav
- Page 13 and 14:
shown. Mynd/Figure 4. Stitched aeri
- Page 15 and 16:
OVERVIEW Karen Milek University of
- Page 17 and 18:
Summary of the Vatnsfjörður Resea
- Page 19 and 20:
floor layer, and is likely to an ea
- Page 21 and 22:
against the 3 m thick, external wes
- Page 23 and 24:
• The digital terrain model of th
- Page 25 and 26:
ÚTGEFNAR, SKÝRSLUR, RITGERÐIR OG
- Page 27 and 28:
ERINDI UM VATNSFJÖRÐ PRESENTATION
- Page 29 and 30:
ANNAÐ PUBLIC OUTREACH Opinn dagur
- Page 31 and 32:
Excavation Methods The excavation o
- Page 33 and 34:
Occupation Phases of Structure 10 S
- Page 35 and 36:
Upon the removal of the gravel plat
- Page 37 and 38:
EXCAVATIONS IN THE FARM MOUND AREA
- Page 39 and 40:
The Excavations Group 10662 Group (
- Page 41 and 42:
Associated with turf blocking [1050
- Page 43 and 44:
contained similar finds as were fou
- Page 45 and 46:
The removal of the deposits excavat
- Page 47 and 48:
sherds, a possible indication of th
- Page 49 and 50:
Figure 11. An overview of extension
- Page 51 and 52:
Group 9502 Group (9502) contains de
- Page 53 and 54:
In 2010 the area was extended to th
- Page 55 and 56:
Figure 16. An overview of room (106
- Page 57 and 58:
Group 10590 Group (10590) is a 7m l
- Page 59 and 60:
At the end of the 2010 season it ha
- Page 61 and 62:
Figure 21. Wall [10644]. Facing eas
- Page 63 and 64:
17th - 18th century 1906 disturbanc
- Page 65 and 66:
Descriptions of Sections Trench 42
- Page 67 and 68:
a b Figure 3. South-facting section
- Page 69 and 70:
EVALUATION TRENCHES EXCAVATED AT VA
- Page 71 and 72:
Trench 37 Around 20 m south-west of
- Page 73 and 74: glazed ceramics, burnt stone, windo
- Page 75 and 76: luish-grey layer of coarse sand [10
- Page 77 and 78: This was thought to be an indicatio
- Page 79 and 80: Table 1. Register of units recorded
- Page 81 and 82: CORING AT HÁLSHÚS AND VATNSFJARÐ
- Page 83 and 84: Visible structure #5 #4 #2 #3 #1 Po
- Page 85 and 86: Vatnsfjarðasel Vatnsfarðasel is l
- Page 87 and 88: silo Main turf building #1 Test #3
- Page 89 and 90: 29-38 cm same as above 38-39 cm cha
- Page 91 and 92: 63-74 cm same as above 74-76 cm lam
- Page 93 and 94: 53-57 cm laminated reddish brown, l
- Page 95 and 96: Organic preservation was generally
- Page 97 and 98: ASSESSMENT AND EVALUATION OF THE AR
- Page 99 and 100: depth has been written about the di
- Page 101 and 102: using an ISIS ABT-55 scanning elect
- Page 103 and 104: Smithing Hearth Bottom During the p
- Page 105 and 106: Fingers, or ‘tendrils’ of flowe
- Page 107 and 108: Classification Counts Weight (kg) u
- Page 109 and 110: Conversely, the small size of undia
- Page 111 and 112: Microscopy The results from the opt
- Page 113 and 114: that iron production and smithing w
- Page 115 and 116: would be a worthy pursuit. The lack
- Page 117 and 118: Milek, K. (2009). Excavations in th
- Page 119 and 120: Archaeometallurgy, eds. S. L. Niece
- Page 121 and 122: Table 2. Showing the size, weight a
- Page 123: Table 4. Showing the dimensions and
- Page 127 and 128: Figure 5. Photographs of two ‘fun
- Page 129 and 130: Figure 9. Examples of technical vit
- Page 131 and 132: Figure 12. BSE image of smelting sl
- Page 133 and 134: Figure 16. Optical micrograph of un
- Page 135 and 136: Figure 20. Photographs of the ten p
- Page 137 and 138: Appendix 1: Abbreviations Undiagnos
- Page 139 and 140: Hammerscale Ferruginous concretions
- Page 141 and 142: pebbles of dense vesicular basalt,
- Page 143 and 144: ID. [324] Mag. Max. Dimensions (cm)
- Page 145 and 146: mixed with the small undiagnostic s
- Page 147 and 148: ID. [6103] Mag. Max. Dimensions (cm
- Page 149 and 150: ID. [...] Finds No. Class. Count We
- Page 151 and 152: Table 1. The 2010 Viking Age faunal
- Page 153 and 154: Combustion Traces Where previously
- Page 155 and 156: BOTANICAL REMAINS FROM A SAMPLE COL
- Page 157 and 158: Figure 1. West-facing section of sa
- Page 159 and 160: Some bioturbation by roots and worm
- Page 161 and 162: 300 Charcoal Volume (ml)/Number Sea
- Page 163 and 164: Discussion Origin of Charcoal As me
- Page 165 and 166: driftwood. All of the driftwood col
- Page 167 and 168: Changes in Charcoal and Seaweed Con
- Page 169 and 170: above the farm, and the two specime
- Page 171 and 172: FRIÐRIKSSON, A. & TULINIUS, T.H. (
- Page 173 and 174: SOIL MICROMORPHOLOGY ASSESSMENT OF
- Page 175 and 176:
suggesting that this side of the bu
- Page 177 and 178:
Figure 2b. Structure 3 in 2006 faci
- Page 179 and 180:
occupation deposit. The floor layer
- Page 181 and 182:
the structure dry by digging down t
- Page 183 and 184:
Bibliography Bullock, P., Fedoroff,
- Page 185 and 186:
Figure 5.3 Description of Sample VS
- Page 187 and 188:
Figure 5.7 Description of Sample VS
- Page 189 and 190:
Figure 5.11 Description of Sample V
- Page 191 and 192:
Figure 5.16 Wood phytolith 50 µm F
- Page 193 and 194:
Figure 5.27 Iron Nodule (OIL) 100
- Page 195 and 196:
Betula pubescens (the native downy
- Page 197 and 198:
An opportunistic sampling strategy
- Page 199 and 200:
POLLEN ANALYSIS OF THE WET MEADOW A
- Page 201 and 202:
Figure 2. Site photograph detailing
- Page 203 and 204:
to low percentages (
- Page 205 and 206:
values were not a result of process
- Page 207 and 208:
Figure 3. Pollen and spore percenta
- Page 209 and 210:
CORRELATION OF TEPHRA LAYERS FROM V
- Page 211 and 212:
and second, to ensure the most accu
- Page 213 and 214:
Figure 2 . Geochemistry of Vatnsfj
- Page 215 and 216:
Thorarinsson, S. (1955b). Nákuðun
- Page 217 and 218:
10038 D 10010 Fill of post-hole [10
- Page 219 and 220:
10569 C 10540 Post hole in hearth (
- Page 221 and 222:
10632 D 8562 A midden deposit in ro
- Page 223 and 224:
10054 D Lower horizon of land surfa
- Page 225 and 226:
ÍS-204 Vatnsfjarðarsel/Seljaland/
- Page 227 and 228:
ÍS-204:001C nokkurra metra kafla b
- Page 229 and 230:
frá henni er Hólhúsótt [011] og
- Page 231 and 232:
ÍS-204:032 Kálgarðsflöt gerði
- Page 233 and 234:
sigið nokkuð inn í rústina fyri
- Page 235 and 236:
... J vatzfirde fiorar merkur“ (D
- Page 237 and 238:
ÍS-205:001 Vatnsfjörður bæjarh
- Page 239 and 240:
grjótholti á breiðum hjalla. Var
- Page 241 and 242:
norðnorðvestur-suðsuðaustur. Ha
- Page 243 and 244:
ÍS-205:011 Nónvarða varða eykta
- Page 245 and 246:
hólfum. Samtals er tóftin 8x7 m o
- Page 247 and 248:
ÍS-205:021 hleðsla refagildra 655
- Page 249 and 250:
ÍS-205:024 Mylluhóll heimild um m
- Page 251 and 252:
verið rutt út. Talið er líklega
- Page 253 and 254:
erfitt að greina lag hennar. Austa
- Page 255 and 256:
ver um 11,5x5 m að innanmáli, þ
- Page 257 and 258:
sóleyjum. Búið að slétta yfir
- Page 259 and 260:
til vesturs. Op er á þeim hluta h
- Page 261 and 262:
ÍS-205:047 varða óþekkt 6556.19
- Page 263 and 264:
Vatnsfirði. Nokkrum metrum austan
- Page 265 and 266:
ÍS-205:059 Að loknum uppgreftri v
- Page 267 and 268:
gæti verið um holur til að elda
- Page 269 and 270:
ÍS-205:068 varða óþekkt 6556.44
- Page 271 and 272:
ÍS-205:076 Selsker varða óþekkt
- Page 273 and 274:
ÍS-205:081 tóft útihús 6556.407
- Page 275 and 276:
Norðaustan við íbúðarhúsið v
- Page 277 and 278:
hún að hluta grafin niður. Garð
- Page 279 and 280:
túnið til norðvesturs. Túngarð
- Page 281 and 282:
Þústin samanstendur af grasþúst
- Page 283 and 284:
ÍS206:032 heimild um kálgarð Um
- Page 285 and 286:
hjallur norðvestan við fjós. Vi
- Page 287 and 288:
Vatnið kemur úr litlu lækjarspr
- Page 289 and 290:
ÍS-208:001 Hálshús bæjarhóll b
- Page 291 and 292:
eru á þeim báðum í miðju, til
- Page 293 and 294:
ÍS-208:012 gerði óþekkt 6554.97