- Page 2:
Principles of Plant Genetics and Br
- Page 6:
Principles of Plant Genetics and Br
- Page 10:
Industry highlights boxes, vii Indu
- Page 14:
Industry highlights boxes Chapter 1
- Page 18:
Industry highlights box authors Acq
- Page 22:
Plant breeding is an art and a scie
- Page 26:
The author expresses sincere gratit
- Page 32:
Section 1 Historical perspectives a
- Page 36:
4 CHAPTER 1 accomplish astonishing
- Page 40:
6 CHAPTER 1 modifying the crop prod
- Page 44:
8 CHAPTER 1 Table 1.2 Selected mile
- Page 48:
10 CHAPTER 1 one season. Furthermor
- Page 52:
12 CHAPTER 1 Figure 1 Dr Norman Bor
- Page 56: 14 CHAPTER 1 agrochemicals. Recent
- Page 60: Section 2 General biological concep
- Page 64: 18 CHAPTER 2 discovered. As will be
- Page 68: 20 CHAPTER 2 antiquity is establish
- Page 72: 22 CHAPTER 2 cultivation in areas a
- Page 76: 24 CHAPTER 2 Table 2.1 Characterist
- Page 80: 26 CHAPTER 2 Table 2.2 An operation
- Page 84: 28 CHAPTER 2 elite germplasm or adv
- Page 88: 30 CHAPTER 2 identify the most prom
- Page 92: 32 CHAPTER 2 Research Institute (SC
- Page 96: 34 CHAPTER 2 Part A Please answer t
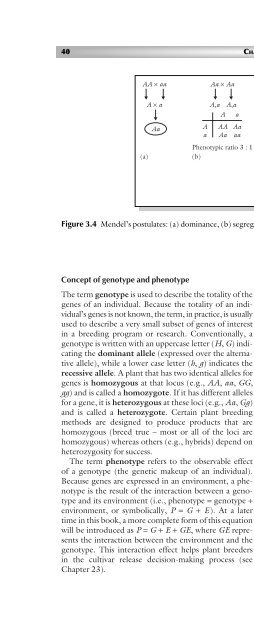
- Page 100: 36 CHAPTER 3 out that when plants a
- Page 104: 38 CHAPTER 3 Table 3.2 Number of ch
- Page 110: Egg 1 /2A 1 /2a 1 /4AA 1 /4Aa Polle
- Page 114: Multiple genes Just as a single gen
- Page 118: Chiasma A A B B A B A A Bivalents b
- Page 122: Individual expresses gene of intere
- Page 126: into proteins. Because genes vary i
- Page 130: First base U U UUU UUC UUA UUG (exo
- Page 134: Inducer removes inhibitor Gene a In
- Page 138: Purpose and expected outcomes Repro
- Page 142: Zygote influenced by the duration o
- Page 146: tobacco). However if a flower lacks
- Page 150: of all gene loci and traits of the
- Page 154: Apomixis Seed production in higher
- Page 158:
Potential pathways for apomixis gen
- Page 162:
(a) (b) PLANT REPRODUCTIVE SYSTEMS
- Page 166:
Stigma Pin flower Thrum flower Figu
- Page 170:
True male sterility There are three
- Page 174:
Kiesselbach, T.A. 1999. The structu
- Page 178:
Purpose and expected outcomes Biolo
- Page 182:
3 Frequently, the scientist who fir
- Page 186:
Types of variation among plants As
- Page 190:
It should be pointed out that recom
- Page 194:
The Ac element has an open reading
- Page 198:
Short short short plants Short shor
- Page 202:
Purpose and expected outcomes As pr
- Page 206:
crossing involving parents from wit
- Page 210:
PLANT GENETIC RESOURCES FOR PLANT B
- Page 214:
(a) Hybrids with GP3 Anomalous, let
- Page 218:
What plant breeders can do to addre
- Page 222:
into wild habitats by livestock far
- Page 226:
ackup collections, active collectio
- Page 230:
elow a certain predetermined level,
- Page 234:
located in developing countries, wh
- Page 238:
and the Animal and Plant Health Ins
- Page 242:
Astley, D. 1987. Genetic resource c
- Page 246:
Purpose and expected outcomes Plant
- Page 250:
Aa, and 51 will be aa. Using the pr
- Page 254:
Disequilibrium 1 0.5 0 0 c = 0.5 Fi
- Page 258:
germplasm collection and maintenanc
- Page 262:
Differential fitness is a factor th
- Page 266:
individual through one parent back
- Page 270:
Purpose and expected outcomes Most
- Page 274:
Polygenes and polygenic inheritance
- Page 278:
of the trait of interest determines
- Page 282:
variation that the primary genetic
- Page 286:
may also be reported as a percentag
- Page 290:
will be advanced, and will conseque
- Page 294:
Frequency Frequency µ µ s Phenoty
- Page 298:
Selection using a restricted index
- Page 302:
INTRODUCTION TO QUANTITATIVE GENETI
- Page 306:
Explicit indices are laborious, req
- Page 310:
This is done for each combination a
- Page 314:
A B C Males (a) Conceptual Paired r
- Page 318:
Falconer, D.S., and T.F.C. Mackay.
- Page 322:
averages, to the more complex multi
- Page 326:
andomization. The blocks should be
- Page 330:
Coefficient of variation The coeffi
- Page 334:
By plugging values for X i , corres
- Page 338:
Multivariate statistics in plant br
- Page 342:
PC3 (15.8%) PC2 (30.72%) 0.10 0.05
- Page 346:
Canonical function II 0.8 0.6 0.4 0
- Page 350:
Discriminant function analysis Disc
- Page 354:
Section 5 Tools in plant breeding C
- Page 358:
Applications of crossing in plant b
- Page 362:
emasculation is not a universal req
- Page 366:
However, in other crosses, the F 2
- Page 370:
Single cross A × B AB Proportion A
- Page 374:
3 Creation of new alloploids. Wide
- Page 378:
SEXUAL HYBRIDIZATION AND WIDE CROSS
- Page 382:
SEXUAL HYBRIDIZATION AND WIDE CROSS
- Page 386:
R. C. Buckner and his colleagues su
- Page 390:
Purpose and expected outcomes The c
- Page 394:
TISSUE CULTURE AND THE BREEDING OF
- Page 398:
previously described. Sometimes, to
- Page 402:
fraction of androgenic grains devel
- Page 406:
Introduction Sergey Chalyk TISSUE C
- Page 410:
TISSUE CULTURE AND THE BREEDING OF
- Page 414:
TISSUE CULTURE AND THE BREEDING OF
- Page 418:
only be maintained by vegetative pr
- Page 422:
Sexually reproductive Apomict New c
- Page 426:
Purpose and expected outcomes It wa
- Page 430:
the same plant. However, the dual c
- Page 434:
1 The ends of the segment may be di
- Page 438:
mutagen frequency is desired, the e
- Page 442:
Introduction F. Laurens MUTAGENESIS
- Page 446:
Climatic adaptation MUTAGENESIS IN
- Page 450:
MUTAGENESIS IN PLANT BREEDING 211 K
- Page 454:
Part A Please answer the following
- Page 458:
Triticum monococcum (2n = 2x = 14)
- Page 462:
(a) (b) A B A B a b a b A B A B a b
- Page 466:
Table 13.4 Genetics of autoploids.
- Page 470:
of sterility because of the odd chr
- Page 474:
(a) (b) (c) Figure 1 (a) Germinated
- Page 478:
Figure 2 In vitro regenerated plant
- Page 482:
(AABBDDRR, 2n = 8x = 56), but it re
- Page 486:
(in alloploids) or homologous (in a
- Page 490:
Purpose and expected outcomes Genes
- Page 494:
and expression (including codon usa
- Page 498:
1 Efficient plant regeneration syst
- Page 502:
Structural defect in the gene const
- Page 506:
sequence analysis. It is an applica
- Page 510:
Analysis BIOTECHNOLOGY IN PLANT BRE
- Page 514:
BIOTECHNOLOGY IN PLANT BREEDING 243
- Page 518:
of genes of known functions. Three
- Page 522:
source of the gene is a wild germpl
- Page 526:
ands for identification may minimiz
- Page 530:
location, genetic effects, and the
- Page 534:
3 Germplasm evaluation. Markers can
- Page 538:
Engineering pest resistance To date
- Page 542:
Purpose and expected outcomes Intel
- Page 546:
the key functions of a patent is to
- Page 550:
The development of truly new and un
- Page 554:
Ethics in plant breeding Manipulati
- Page 558:
Introduction ISSUES IN THE APPLICAT
- Page 562:
ISSUES IN THE APPLICATION OF BIOTEC
- Page 566:
Overview of the regulation of the U
- Page 570:
Table 15.2 Some viral-coated protei
- Page 574:
conditions. Further, these phenotyp
- Page 578:
there is no inherent health risk in
- Page 582:
esistance concerns (or “collatera
- Page 586:
Damage to economic interest (market
- Page 590:
Section 6 Classic methods of plant
- Page 594:
Open-pollinated cultivars Contrary
- Page 598:
Common plant breeding notations Pla
- Page 602:
(a) Year 1 Year 2 Year 3 (b) Source
- Page 606:
2 Cultivars developed for a discrim
- Page 610:
especially where readily identifiab
- Page 614:
Comments 1 Growing parents, making
- Page 618:
Comments Generation Year 1 P 1 × P
- Page 622:
3 Natural selection may increase fr
- Page 626:
5 Every plant originates from a dif
- Page 630:
1 year BREEDING SELF-POLLINATED SPE
- Page 634:
BREEDING SELF-POLLINATED SPECIES 30
- Page 638:
Year 1 Year 2 F 1 Year 3 Year 4 Yea
- Page 642:
2 Extensive advanced testing is not
- Page 646:
Applications One of the earliest ap
- Page 650:
species (maize) and has been a majo
- Page 654:
Purpose and expected outcomes As pr
- Page 658:
epistatic interactions enhance the
- Page 662:
Season 1 Source population C 0 Seas
- Page 666:
Procedure: cycle 1 This is the same
- Page 670:
Advantages and disadvantages The ma
- Page 674:
(a) (b) Figure 1 Examples of (a) Po
- Page 678:
Figure 3 Range of seed development
- Page 682:
Applications The scheme has been us
- Page 686:
stems from several biological facto
- Page 690:
Factors affecting the performance o
- Page 694:
7 Give a specific disadvantage of m
- Page 698:
Other notable advances in the breed
- Page 702:
BREEDING HYBRID CULTIVARS 337 ducin
- Page 706:
BREEDING HYBRID CULTIVARS 339 for c
- Page 710:
of interest. As Falconer indicated,
- Page 714:
patterns derived from the same open
- Page 718:
(a) (b) Seed parent (male-sterile)
- Page 722:
Table 18.1 Calculating heat units a
- Page 726:
such as sugarcane (most commercial
- Page 730:
Section 7 Selected breeding objecti
- Page 734:
water utilization, photoperiod, har
- Page 738:
expense of the rest of the plant. N
- Page 742:
usually results from one component
- Page 746:
Figure 3 Field trials demonstrating
- Page 750:
References Concept of yield plateau
- Page 754:
Shatter-sensitive cultivars are sus
- Page 758:
Nature, types, and economic importa
- Page 762:
Purpose and expected outcomes Plant
- Page 766:
elative to a benchmark. A genotype
- Page 770:
Types of genetic resistance The com
- Page 774:
General considerations for breeding
- Page 778:
for most middling resistance. It sh
- Page 782:
pathogen to give resistance), was c
- Page 786:
BREEDING FOR RESISTANCE TO DISEASES
- Page 790:
BREEDING FOR RESISTANCE TO DISEASES
- Page 794:
5 The plant or cell overproduces th
- Page 798:
Purpose and expected outcomes Clima
- Page 802:
ultimately its productivity and eco
- Page 806:
Breeding for drought resistance Dro
- Page 810:
drought. Consequently, phenotypic s
- Page 814:
BREEDING FOR RESISTANCE TO ABIOTIC
- Page 818:
More N partitioned to leaves before
- Page 822:
interruption in normal germination,
- Page 826:
Table 21.1 Relative salt tolerance
- Page 830:
toxicities of economic importance t
- Page 834:
Acevedo, E., and E. Fereres. 1993.
- Page 838:
Table 22.1 Essential amino acids th
- Page 842:
BREEDING COMPOSITIONAL TRAITS AND A
- Page 846:
Figure 1 Farmer (left) and research
- Page 850:
the presence of β-carotene, but no
- Page 854:
and cell walls are degraded. There
- Page 858:
milling, extraction of oil, starch
- Page 862:
Section 8 Cultivar release and comm
- Page 866:
in two stages. The first stage, cal
- Page 870:
genotype is reduced. This raises th
- Page 874:
Different models of ANOVA are used
- Page 878:
Table 23.2 Stability analysis. PERF
- Page 882:
PERFORMANCE EVALUATION FOR CROP CUL
- Page 886:
esources available (land, seed, lab
- Page 890:
Advantages 1 It is the simplest of
- Page 894:
Mapping populations have additional
- Page 898:
Purpose and expected outcomes The u
- Page 902:
Funk Columbiana Farm Seed Germain
- Page 906:
Joe W. Burton SEED CERTIFICATION AN
- Page 910:
Registered seed Registered seed is
- Page 914:
Canada’s Plant Breeders’ Rights
- Page 918:
Seed certification process There ar
- Page 922:
Table 24.1 Information on a seed ta
- Page 926:
Boswell, V.R. 1961. The importance
- Page 930:
property is a major one in plant br
- Page 934:
important issues to be considered i
- Page 938:
Soybean Soybean research is conduct
- Page 942:
INTERNATIONAL PLANT BREEDING EFFORT
- Page 946:
Selected accomplishments The impact
- Page 950:
national entities. More importantly
- Page 954:
Cicarelli contest that most farmers
- Page 958:
EMERGING CONCEPTS IN PLANT BREEDING
- Page 962:
EMERGING CONCEPTS IN PLANT BREEDING
- Page 966:
Principles of organic plant breedin
- Page 970:
Part II Breeding selected crops Cha
- Page 974:
Adaptation Wheat is best adapted to
- Page 978:
are less successful, being of poor
- Page 982:
Introduction BREEDING WHEAT 477 Ind
- Page 986:
Host plant resistance to disease an
- Page 990:
Greenhouse nursery Breeders may use
- Page 994:
when the production area is isolate
- Page 998:
Taxonomy Kingdom Plantae Subkingdom
- Page 1002:
encloses the soft starch at the cen
- Page 1006:
Designated ms 1 , ms 2 ,...ms n , o
- Page 1010:
F. J. Betrán Texas A&M University,
- Page 1014:
Development of hybrids BREEDING COR
- Page 1018:
chambers may be used for experiment
- Page 1022:
orer. A chemical found in corn with
- Page 1026:
A British sea captain brought rice
- Page 1030:
while awnless is conditioned by an
- Page 1034:
Figure 1 Rice panicle being prepare
- Page 1038:
Figure 5 A foundation seed field of
- Page 1042:
emoved with forceps, the cut may be
- Page 1046:
Taxonomy Kingdom Plantae Subkingdom
- Page 1050:
green midrib because of the presenc
- Page 1054:
BREEDING SORGHUM 513 Kansas State U
- Page 1058:
Summer Year 5 Summer Year 7 Summer
- Page 1062:
covered with the bag. Pollination s
- Page 1066:
Taxonomy Kingdom Plantae Subkingdom
- Page 1070:
and brown being dominant over gray.
- Page 1074:
BREEDING SOYBEAN 523 easily selecte
- Page 1078:
BREEDING SOYBEAN 525 An advantage o
- Page 1082:
Common breeding objectives 1 Grain
- Page 1086:
Taxonomy Kingdom Plantae Subkingdom
- Page 1090:
Program objectives Charles Simpson
- Page 1094:
BREEDING PEANUT 533 lines in hopes
- Page 1098:
for emasculation, which is done in
- Page 1102:
Taxonomy Kingdom Plantae Subkingdom
- Page 1106:
Evolution of the modern potato crop
- Page 1110:
BREEDING POTATO 541 Table 1 The Sco
- Page 1114:
(berries) called potato balls. The
- Page 1118:
6 Potato tuber quality improvement.
- Page 1122:
grown in America, Africa, Asia, and
- Page 1126:
Introduction Don L. Keim BREEDING C
- Page 1130:
BREEDING COTTON 551 are grown in tr
- Page 1134:
economically important traits has b
- Page 1138:
Part B Please answer the following
- Page 1142:
Central dogma: The underlying model
- Page 1146:
Mitosis: The process of nuclear div
- Page 1150:
Chapter 1 http://www.foodfirst.org/
- Page 1154:
Imperial unit Metric conversion Vol
- Page 1158:
complex inheritance, 42 composite c
- Page 1162:
minor gene resistance, 371 minor ge
- Page 1166:
technology protection system (TPS),


